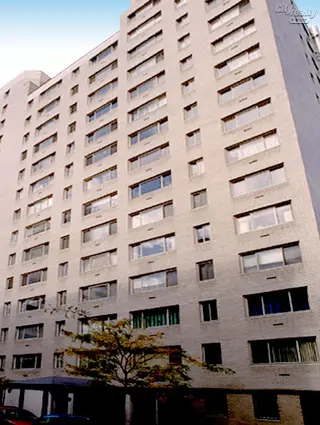
401 East 65th Street: Sales Summary
between First Avenue & York Avenue Building Profile
All Sales
$904
Avg. Price / ft2
Past 12 months, based on 10 sales
$610,900
Avg. Price -
Past 12 months, based on 10 sales
$890
Median Price / ft2
Past 12 months, based on 10 sales
$552,500
Median Price
Past 12 months, based on 10 sales
Year
Avg Price / Ft2
Median Price / Ft2
Avg. Actual Price
Med. Actual Price
Transactions
2025
$933
$925,000
$933
$925,000
2
2024
$882
$540,900
$846
$547,000
10
2023
$934
$582,000
$928
$446,000
7
2022
$841
$591,500
$841
$481,000
8
2021
$913
$727,778
$875
$590,000
9
2020
$932
$875,625
$932
$828,750
4
2019
$812
$548,100
$814
$470,000
5
2018
-
$390,000
-
$390,000
1
2017
$864
$650,400
$864
$553,000
5
2016
$963
$793,429
$936
$519,000
7
2015
$843
$594,500
$907
$529,000
9
2014
$764
$649,000
$764
$665,000
7
2013
$751
$617,200
$777
$510,000
10
Year
Avg Price / Ft2
Median Price / Ft2
Avg. Actual Price
Med. Actual Price
Transactions
2012
$644
$605,714
$643
$520,000
7
2011
$638
$455,100
$634
$417,500
5
2010
$664
$472,944
$670
$367,500
9
2009
$680
$577,083
$680
$556,250
6
2008
$748
$551,000
$717
$394,500
4
2007
$738
$593,250
$735
$490,000
8
2006
$684
$491,988
$683
$462,450
8
2005
$641
$568,038
$628
$530,000
13
2004
$520
$401,964
$536
$300,000
14
2003
$400
$393,833
$400
$231,500
6
The Breakdown of All Sales by Apartment Size