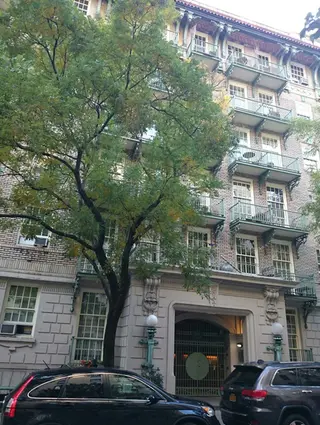
The Cherokee, 508 East 78th Street: Sales Summary
between York Avenue & Cherokee Place Building Profile
All Sales
$1,087
Avg. Price / ft2
Past 12 months, based on 2 sales
$547,500
Avg. Price -
Past 12 months, based on 2 sales
$1,087
Median Price / ft2
Past 12 months, based on 2 sales
$547,500
Median Price
Past 12 months, based on 2 sales
Year
Avg Price / Ft2
Median Price / Ft2
Avg. Actual Price
Med. Actual Price
Transactions
2025
$1,087
$547,500
$1,087
$547,500
2
2024
-
-
-
-
0
2023
-
-
-
-
0
2022
$944
$532,500
$944
$405,000
4
2021
$1,045
$541,563
$1,045
$455,000
8
2020
-
-
-
-
0
2019
$798
$630,000
$798
$630,000
2
2018
$958
$505,000
$929
$365,000
9
2017
$760
$466,215
$760
$382,500
6
2016
-
$624,488
-
$624,488
1
2015
-
$358,750
-
$358,750
2
2014
$740
$469,403
$740
$390,000
5
2013
$793
$342,180
$793
$332,500
4
Year
Avg Price / Ft2
Median Price / Ft2
Avg. Actual Price
Med. Actual Price
Transactions
2012
$645
$289,583
$697
$271,250
6
2011
$580
$320,000
$580
$320,000
2
2010
-
$350,000
$350,000
2
2009
$663
$325,792
$663
$343,083
4
2008
$523
$311,473
$523
$311,473
2
2007
$621
$361,056
$621
$333,811
8
2006
$760
$328,890
$789
$310,000
5
2005
$650
$339,700
$650
$255,000
5
2004
$354
$225,251
$354
$209,250
8
2003
$430
$196,121
$430
$180,000
7
The Breakdown of All Sales by Apartment Size