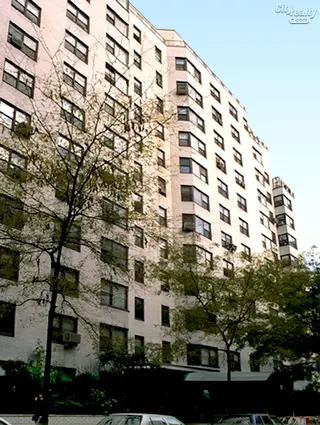
Manhattan East, 315 East 65th Street: Sales Summary
between Second Avenue & First Avenue Building Profile
All Sales
$909
Avg. Price / ft2
Past 12 months, based on 9 sales
$999,556
Avg. Price -
Past 12 months, based on 9 sales
$912
Median Price / ft2
Past 12 months, based on 9 sales
$845,000
Median Price
Past 12 months, based on 9 sales
Year
Avg Price / Ft2
Median Price / Ft2
Avg. Actual Price
Med. Actual Price
Transactions
2025
-
$940,000
-
$875,000
3
2024
$842
$1,128,444
$902
$925,000
9
2023
$944
$1,662,500
$944
$1,662,500
2
2022
$997
$1,178,571
$994
$1,250,000
7
2021
$845
$1,544,840
$845
$1,137,500
5
2020
$987
$1,202,000
$1,037
$1,300,000
5
2019
$860
$982,000
$860
$865,000
5
2018
$1,053
$1,200,000
$1,053
$1,200,000
2
2017
$964
$1,092,500
$932
$1,112,500
4
2016
$1,174
$987,451
$1,174
$987,451
2
2015
$841
$641,625
$841
$596,250
4
2014
$790
$913,815
$790
$868,750
4
2013
$797
$778,288
$918
$659,000
9
Year
Avg Price / Ft2
Median Price / Ft2
Avg. Actual Price
Med. Actual Price
Transactions
2012
$750
$1,500,000
$750
$1,500,000
1
2011
$759
$757,167
$764
$722,500
6
2010
$739
$906,805
$724
$690,000
9
2009
$557
$648,200
$611
$551,000
5
2008
$654
$687,742
$757
$738,500
6
2007
$759
$824,500
$759
$755,000
6
2006
$686
$1,066,625
$686
$880,750
4
2005
$702
$664,640
$694
$637,500
10
2004
$604
$755,000
$604
$830,000
4
2003
$414
$490,400
$414
$380,000
3
The Breakdown of All Sales by Apartment Size

 6sqft delivers the latest on real estate, architecture, and design, straight from New York City.
