Newport East, 370 East 76th Street - Lenox Hill
- Apartments
- Overview & Photos
- Maps
- Floorplans
- Sales Data & Comps
- Similar Buildings
- All Units


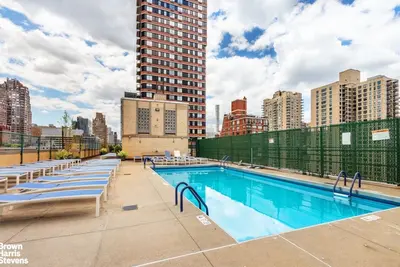


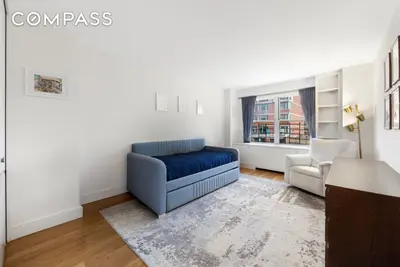


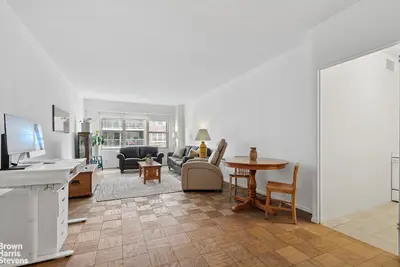
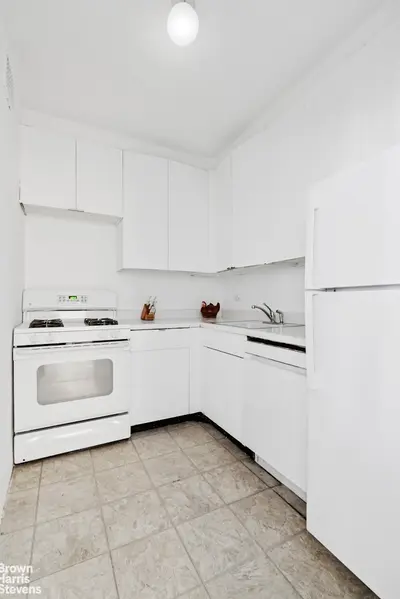
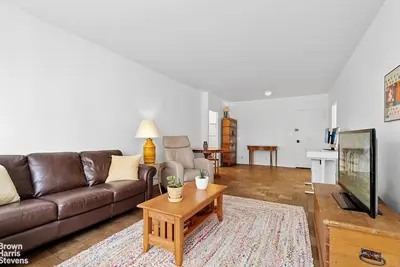
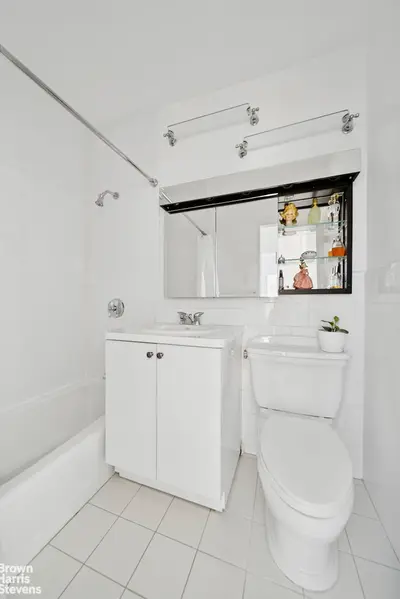
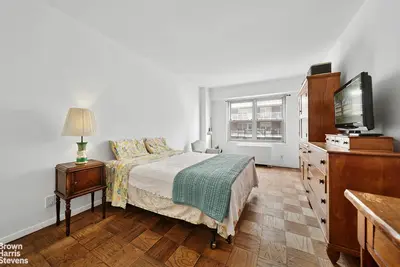


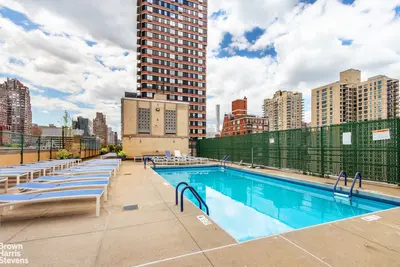


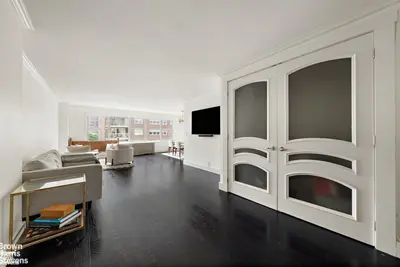


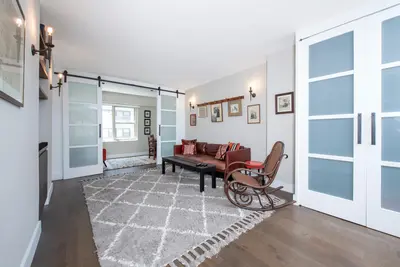
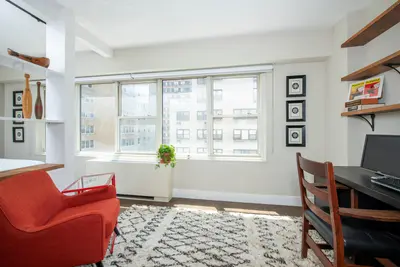


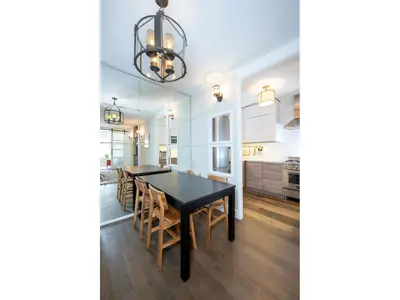


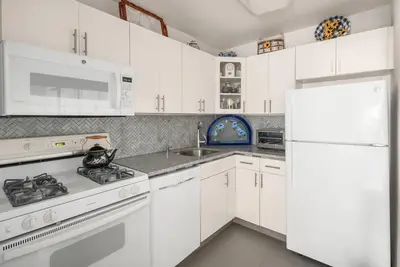


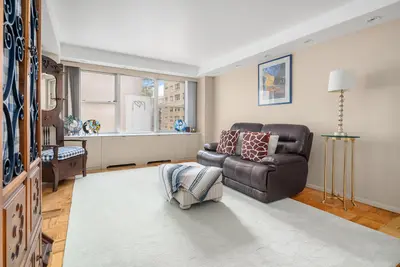
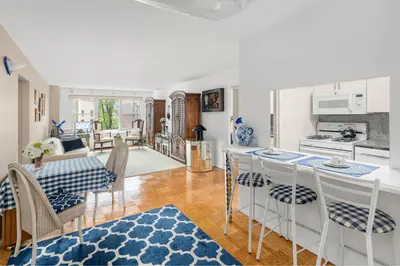

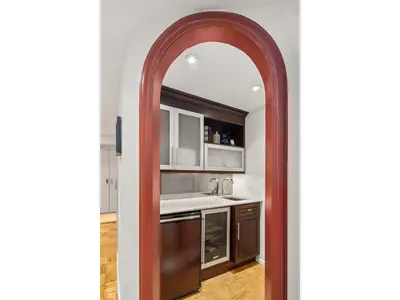


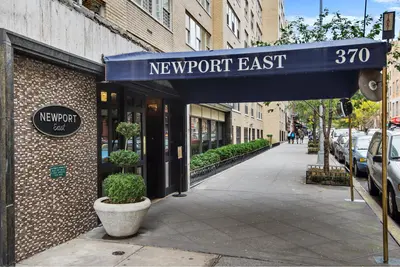


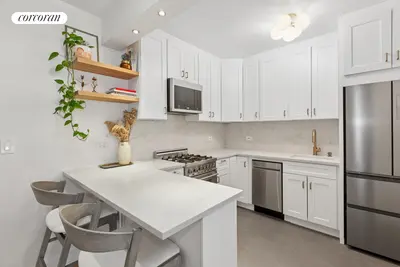
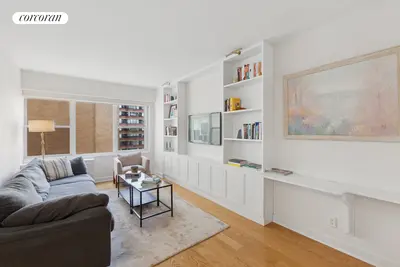
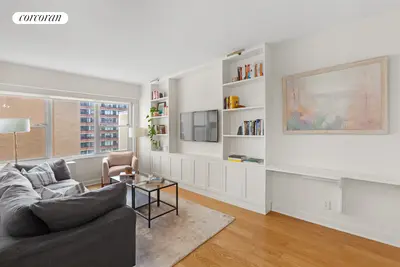
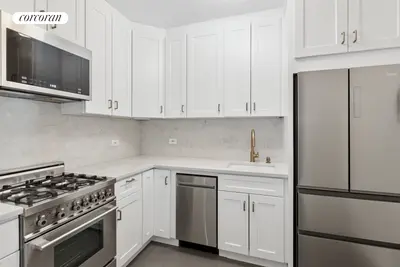
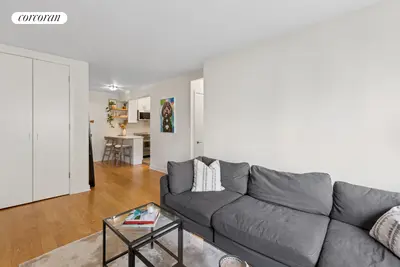


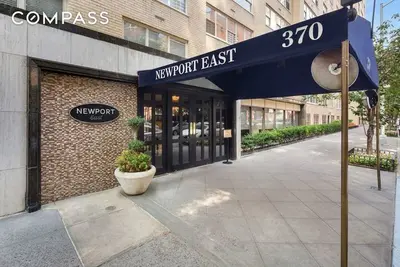


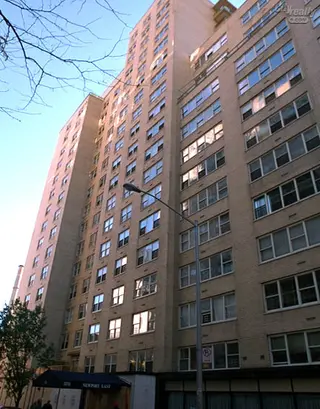
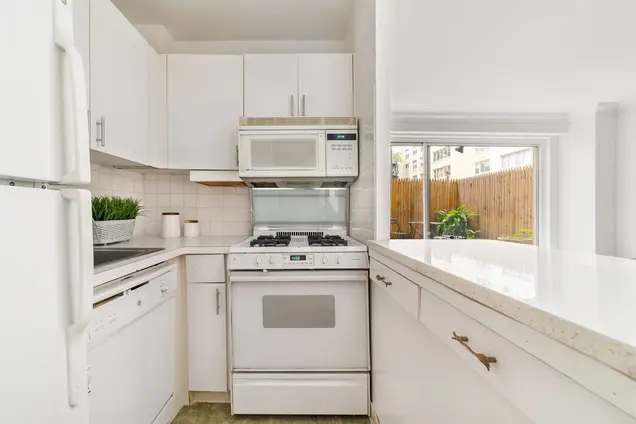
The Newport at 370 East 76th Street in Lenox Hill on the Upper East Side is a 19-story condominium with 366 units. The building offers a 24 hour doorman, concierge, live-in superintendent, roof deck with seasonal heated pool, storage facility, bicycle room, luggage room, laundry room, and on-site garage with a discounted rate for shareholders. Guarantors are permitted, as are pets under 30 pounds. Pied-a-terres are not permitted.


View school info, local attractions, transportation options & more.
Experience amazing 3D aerial maps and fly throughs.
For some co-ops, instead of price per square foot, we use an estimate of the number of rooms for each sold apartment to chart price changes over time. This is because many co-op listings do not include square footage information, and this makes it challenging to calculate accurate square-foot averages.
By displaying the price per estimated room count, we are able to provide a more reliable and consistent metric for comparing sales in the building. While we hope that this gives you a clearer sense of price trends in the building, all data should be independently verified. All data provided are only estimates and should not be used to make any purchase or sale decision.
Notable past and present residents at Newport East
Broker & Buyer Comments