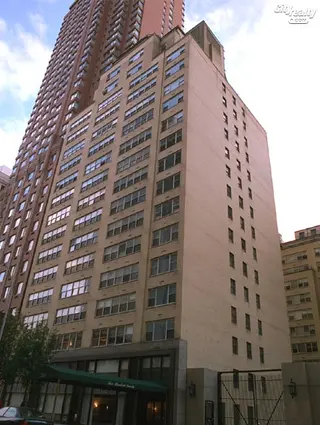
Parker 72nd, 520 East 72nd Street: Sales Summary
between York Avenue & East River Drive Building Profile
All Sales
$797
Avg. Price / ft2
Past 12 months, based on 12 sales
$517,583
Avg. Price -
Past 12 months, based on 12 sales
$800
Median Price / ft2
Past 12 months, based on 12 sales
$533,000
Median Price
Past 12 months, based on 12 sales
Year
Avg Price / Ft2
Median Price / Ft2
Avg. Actual Price
Med. Actual Price
Transactions
2025
-
$611,500
-
$611,500
2
2024
$798
$482,253
$800
$505,500
14
2023
$855
$574,650
$855
$522,500
10
2022
$762
$599,500
$753
$480,000
18
2021
$785
$487,400
$785
$492,500
10
2020
$785
$513,333
$785
$504,500
12
2019
$846
$525,923
$810
$465,000
13
2018
$908
$631,000
$908
$560,000
17
2017
$908
$591,833
$878
$585,500
6
2016
$841
$722,191
$854
$590,600
11
2015
$722
$574,535
$700
$460,000
13
2014
$671
$399,650
$657
$403,000
10
2013
$618
$368,958
$646
$334,500
12
Year
Avg Price / Ft2
Median Price / Ft2
Avg. Actual Price
Med. Actual Price
Transactions
2012
$585
$370,233
$606
$330,000
15
2011
$599
$374,377
$619
$348,901
18
2010
$602
$427,857
$596
$375,000
7
2009
$641
$415,650
$658
$388,750
10
2008
$753
$461,150
$766
$451,750
10
2007
$662
$464,000
$646
$422,500
14
2006
$637
$393,308
$625
$395,000
13
2005
$566
$413,567
$602
$394,000
9
2004
$433
$403,407
$433
$255,000
9
2003
$405
$310,154
$392
$270,000
13
The Breakdown of All Sales by Apartment Size