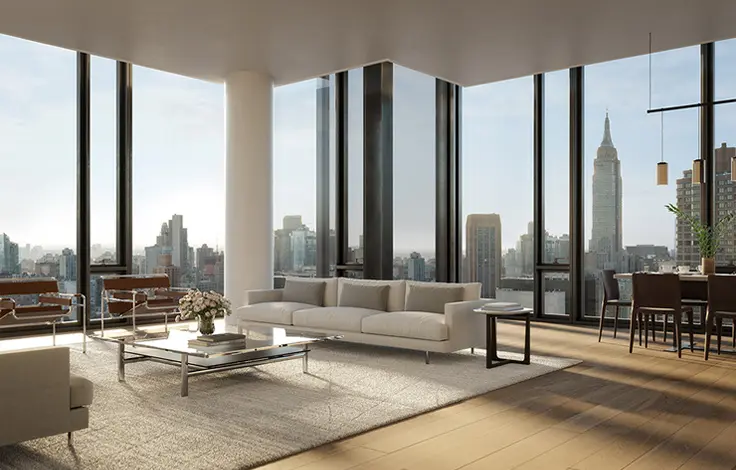
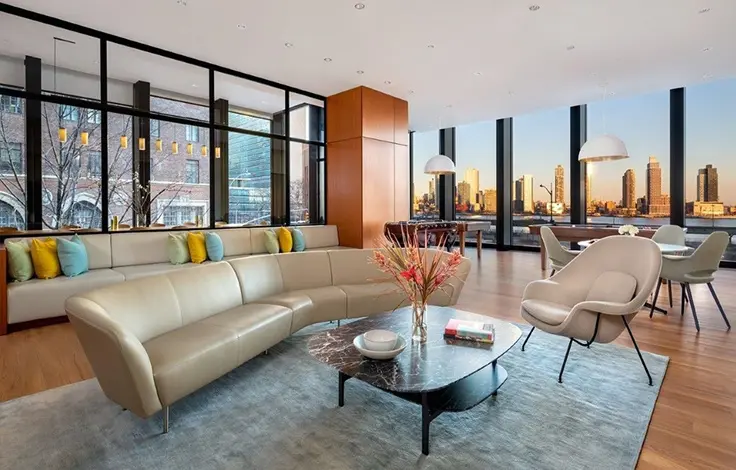
The Black & Whites, 531 East 72nd Street: Price Comparison
between York Avenue & East River Drive Building Profile
The Black & Whites
$450,000
Avg. Price
Past 12 months
Past 12 months
2023
$800,000
2022
-
2021
-
2020
$525,000
2019
-
2018
-
2017
-
2016
$1,305,000
2015
$825,000
2014
$673,333
2013
$495,000
2012
$387,000
2011
-
2010
-
2009
-
2008
-
2007
$250,000
2006
-
2005
-
2004
$565,000
2003
$365,000
The Black & Whites
$450,000
Median Price
Past 12 months
Past 12 months
2023
$800,000
2022
-
2021
-
2020
$525,000
2019
-
2018
-
2017
-
2016
$1,305,000
2015
$825,000
2014
$385,000
2013
$495,000
2012
$387,000
2011
-
2010
-
2009
-
2008
-
2007
$250,000
2006
-
2005
-
2004
$565,000
2003
$365,000
The Black & Whites
$450,000
Avg. Price
Past 12 months
Past 12 months
2023
-
2022
-
2021
-
2020
-
2019
-
2018
-
2017
-
2016
-
2015
-
2014
-
2013
-
2012
-
2011
-
2010
-
2009
-
2008
-
2007
$250,000
2006
-
2005
-
2004
-
2003
-
The Black & Whites
$450,000
Median Price
Past 12 months
Past 12 months
2023
-
2022
-
2021
-
2020
-
2019
-
2018
-
2017
-
2016
-
2015
-
2014
-
2013
-
2012
-
2011
-
2010
-
2009
-
2008
-
2007
$250,000
2006
-
2005
-
2004
-
2003
-
The Black & Whites
N/A
Avg. Price
Past 12 months
Past 12 months
2023
-
2022
-
2021
-
2020
$525,000
2019
-
2018
-
2017
-
2016
-
2015
-
2014
$380,000
2013
-
2012
$387,000
2011
-
2010
-
2009
-
2008
-
2007
-
2006
-
2005
-
2004
-
2003
-
The Black & Whites
N/A
Median Price
Past 12 months
Past 12 months
2023
-
2022
-
2021
-
2020
$525,000
2019
-
2018
-
2017
-
2016
-
2015
-
2014
$380,000
2013
-
2012
$387,000
2011
-
2010
-
2009
-
2008
-
2007
-
2006
-
2005
-
2004
-
2003
-
The Black & Whites
N/A
Avg. Price
Past 12 months
Past 12 months
2023
$800,000
2022
-
2021
-
2020
-
2019
-
2018
-
2017
-
2016
-
2015
$825,000
2014
-
2013
$495,000
2012
-
2011
-
2010
-
2009
-
2008
-
2007
-
2006
-
2005
-
2004
$565,000
2003
$365,000
The Black & Whites
N/A
Median Price
Past 12 months
Past 12 months
2023
$800,000
2022
-
2021
-
2020
-
2019
-
2018
-
2017
-
2016
-
2015
$825,000
2014
-
2013
$495,000
2012
-
2011
-
2010
-
2009
-
2008
-
2007
-
2006
-
2005
-
2004
$565,000
2003
$365,000
The Black & Whites
N/A
Avg. Price
Past 12 months
Past 12 months
2023
-
2022
-
2021
-
2020
-
2019
-
2018
-
2017
-
2016
-
2015
-
2014
-
2013
-
2012
-
2011
-
2010
-
2009
-
2008
-
2007
-
2006
-
2005
-
2004
-
2003
-
The Black & Whites
N/A
Median Price
Past 12 months
Past 12 months
2023
-
2022
-
2021
-
2020
-
2019
-
2018
-
2017
-
2016
-
2015
-
2014
-
2013
-
2012
-
2011
-
2010
-
2009
-
2008
-
2007
-
2006
-
2005
-
2004
-
2003
-
The Black & Whites
N/A
Avg. Price
Past 12 months
Past 12 months
2023
-
2022
-
2021
-
2020
-
2019
-
2018
-
2017
-
2016
$1,305,000
2015
-
2014
$1,260,000
2013
-
2012
-
2011
-
2010
-
2009
-
2008
-
2007
-
2006
-
2005
-
2004
-
2003
-
The Black & Whites
N/A
Median Price
Past 12 months
Past 12 months
2023
-
2022
-
2021
-
2020
-
2019
-
2018
-
2017
-
2016
$1,305,000
2015
-
2014
$1,260,000
2013
-
2012
-
2011
-
2010
-
2009
-
2008
-
2007
-
2006
-
2005
-
2004
-
2003
-
The Black & Whites
N/A
Avg. Price
Past 12 months
Past 12 months
2023
-
2022
-
2021
-
2020
-
2019
-
2018
-
2017
-
2016
-
2015
-
2014
-
2013
-
2012
-
2011
-
2010
-
2009
-
2008
-
2007
-
2006
-
2005
-
2004
-
2003
-
The Black & Whites
N/A
Median Price
Past 12 months
Past 12 months
2023
-
2022
-
2021
-
2020
-
2019
-
2018
-
2017
-
2016
-
2015
-
2014
-
2013
-
2012
-
2011
-
2010
-
2009
-
2008
-
2007
-
2006
-
2005
-
2004
-
2003
-
The Cherokee
$1,000
Avg. Price / ft2
Past 12 months
Past 12 months
-
$883
-
-
$799
-
-
$1,037
$925
$922
-
-
$689
$731
$663
$662
$714
$660
$730
$750
$425
The Cherokee
$650,000
Avg. Price
Past 12 months
Past 12 months
$325,000
$553,500
-
-
$574,671
$400,000
$382,000
$409,143
$477,000
$483,589
$372,500
$277,000
$344,267
$292,500
$344,326
$430,000
$425,372
$383,263
$343,125
$216,857
$262,863
The Cherokee
$650,000
Median Price
Past 12 months
Past 12 months
$325,000
$553,500
-
-
$612,013
$400,000
$382,000
$400,000
$441,000
$464,500
$372,500
$285,000
$299,000
$292,500
$351,267
$430,000
$391,782
$330,277
$317,500
$200,000
$277,500
The Cherokee
N/A
Avg. Price / ft2
Past 12 months
Past 12 months
-
-
-
-
-
-
-
-
-
-
-
-
-
-
-
-
-
-
-
-
-
The Cherokee
N/A
Avg. Price
Past 12 months
Past 12 months
-
-
-
-
-
$400,000
$395,000
-
-
-
-
$295,000
$270,000
-
$323,622
-
-
$361,553
$260,000
$215,000
$205,000
The Cherokee
N/A
Median Price
Past 12 months
Past 12 months
-
-
-
-
-
$400,000
$395,000
-
-
-
-
$295,000
$270,000
-
$323,622
-
-
$361,553
$260,000
$200,000
$205,000
The Cherokee
$1,000
Avg. Price / ft2
Past 12 months
Past 12 months
-
$883
-
-
$916
-
-
$1,037
$925
-
-
-
$689
$725
$663
$662
$764
$598
$768
$750
$463
The Cherokee
$650,000
Avg. Price
Past 12 months
Past 12 months
-
$553,500
-
-
$412,000
-
$369,000
$377,500
$477,000
$445,634
-
$285,000
$381,400
$290,000
$347,450
$430,000
$351,693
$297,000
$331,000
$231,000
$226,667
The Cherokee
$650,000
Median Price
Past 12 months
Past 12 months
-
$553,500
-
-
$412,000
-
$369,000
$352,500
$441,000
$446,267
-
$285,000
$381,400
$290,000
$354,855
$430,000
$323,078
$297,000
$340,000
$249,000
$270,000
The Cherokee
N/A
Avg. Price / ft2
Past 12 months
Past 12 months
-
-
-
-
$683
-
-
-
-
$922
-
-
-
$738
-
-
$663
$722
$674
-
$387
The Cherokee
N/A
Avg. Price
Past 12 months
Past 12 months
-
-
-
-
$700,000
-
-
$488,250
-
$559,500
$372,500
$251,000
-
$295,000
$352,534
-
$535,891
$577,500
$415,000
$180,000
$346,090
The Cherokee
N/A
Median Price
Past 12 months
Past 12 months
-
-
-
-
$700,000
-
-
$488,250
-
$559,500
$372,500
$251,000
-
$295,000
$352,534
-
$535,891
$577,500
$415,000
$180,000
$346,090
The Cherokee
N/A
Avg. Price / ft2
Past 12 months
Past 12 months
-
-
-
-
-
-
-
-
-
-
-
-
-
-
-
-
-
-
-
-
-
The Cherokee
N/A
Avg. Price
Past 12 months
Past 12 months
-
-
-
-
-
-
-
-
-
-
-
-
-
-
-
-
-
-
-
-
-
The Cherokee
N/A
Median Price
Past 12 months
Past 12 months
-
-
-
-
-
-
-
-
-
-
-
-
-
-
-
-
-
-
-
-
-
The Cherokee
N/A
Avg. Price / ft2
Past 12 months
Past 12 months
-
-
-
-
-
-
-
-
-
-
-
-
-
-
-
-
-
-
-
-
-
The Cherokee
N/A
Avg. Price
Past 12 months
Past 12 months
-
-
-
-
-
-
-
-
-
-
-
-
-
-
-
-
-
-
-
-
-
The Cherokee
N/A
Median Price
Past 12 months
Past 12 months
-
-
-
-
-
-
-
-
-
-
-
-
-
-
-
-
-
-
-
-
-
519 East 86th Street
N/A
Avg. Price / ft2
Past 12 months
Past 12 months
-
$701
-
-
$881
$974
-
-
-
$649
$773
$742
$589
-
$583
$689
$826
$555
-
$520
$333
519 East 86th Street
N/A
Avg. Price
Past 12 months
Past 12 months
$879,500
$1,493,500
-
-
$749,000
$1,442,500
$750,000
$1,670,000
$2,650,000
$990,100
$850,000
$1,178,750
$795,000
-
$700,000
$620,000
$729,500
$499,550
-
$510,000
$336,250
519 East 86th Street
N/A
Median Price
Past 12 months
Past 12 months
$879,500
$1,493,500
-
-
$749,000
$1,442,500
$750,000
$1,670,000
$2,650,000
$600,000
$850,000
$1,178,750
$795,000
-
$700,000
$620,000
$729,500
$499,550
-
$510,000
$336,250
519 East 86th Street
N/A
Avg. Price / ft2
Past 12 months
Past 12 months
-
-
-
-
-
-
-
-
-
-
-
-
-
-
-
-
-
-
-
-
-
519 East 86th Street
N/A
Avg. Price
Past 12 months
Past 12 months
-
-
-
-
-
-
-
-
-
-
-
-
-
-
-
-
-
-
-
-
-
519 East 86th Street
N/A
Median Price
Past 12 months
Past 12 months
-
-
-
-
-
-
-
-
-
-
-
-
-
-
-
-
-
-
-
-
-
519 East 86th Street
N/A
Avg. Price / ft2
Past 12 months
Past 12 months
-
-
-
-
$881
-
-
-
-
$649
-
-
-
-
-
$689
-
$555
-
$520
$333
519 East 86th Street
N/A
Avg. Price
Past 12 months
Past 12 months
-
-
-
-
$749,000
-
-
$545,000
-
$581,375
-
-
-
-
-
$620,000
$650,000
$499,550
-
$510,000
$336,250
519 East 86th Street
N/A
Median Price
Past 12 months
Past 12 months
-
-
-
-
$749,000
-
-
$545,000
-
$580,000
-
-
-
-
-
$620,000
$650,000
$499,550
-
$510,000
$336,250
519 East 86th Street
N/A
Avg. Price / ft2
Past 12 months
Past 12 months
-
$701
-
-
-
-
-
-
-
-
$773
$551
-
-
$583
-
$826
-
-
-
-
519 East 86th Street
N/A
Avg. Price
Past 12 months
Past 12 months
$879,500
$687,000
-
-
-
$985,000
$750,000
-
-
-
$850,000
$540,000
-
-
$700,000
-
$809,000
-
-
-
-
519 East 86th Street
N/A
Median Price
Past 12 months
Past 12 months
$879,500
$687,000
-
-
-
$985,000
$750,000
-
-
-
$850,000
$540,000
-
-
$700,000
-
$809,000
-
-
-
-
519 East 86th Street
N/A
Avg. Price / ft2
Past 12 months
Past 12 months
-
-
-
-
-
-
-
-
-
-
-
-
$589
-
-
-
-
-
-
-
-
519 East 86th Street
N/A
Avg. Price
Past 12 months
Past 12 months
-
-
-
-
-
-
-
-
-
$2,625,000
-
-
$795,000
-
-
-
-
-
-
-
-
519 East 86th Street
N/A
Median Price
Past 12 months
Past 12 months
-
-
-
-
-
-
-
-
-
$2,625,000
-
-
$795,000
-
-
-
-
-
-
-
-
519 East 86th Street
N/A
Avg. Price / ft2
Past 12 months
Past 12 months
-
-
-
-
-
$974
-
-
-
-
-
$932
-
-
-
-
-
-
-
-
-
519 East 86th Street
N/A
Avg. Price
Past 12 months
Past 12 months
-
$2,300,000
-
-
-
$1,900,000
-
$2,795,000
-
-
-
$1,817,500
-
-
-
-
-
-
-
-
-
519 East 86th Street
N/A
Median Price
Past 12 months
Past 12 months
-
$2,300,000
-
-
-
$1,900,000
-
$2,795,000
-
-
-
$1,817,500
-
-
-
-
-
-
-
-
-
519 East 86th Street
N/A
Avg. Price / ft2
Past 12 months
Past 12 months
-
-
-
-
-
-
-
-
-
-
-
-
-
-
-
-
-
-
-
-
-
519 East 86th Street
N/A
Avg. Price
Past 12 months
Past 12 months
-
-
-
-
-
-
-
-
-
-
-
-
-
-
-
-
-
-
-
-
-
519 East 86th Street
N/A
Median Price
Past 12 months
Past 12 months
-
-
-
-
-
-
-
-
-
-
-
-
-
-
-
-
-
-
-
-
-
The Black & Whites
N/A
Avg. Price / ft2
Past 12 months
Past 12 months
-
-
-
-
-
-
-
-
-
-
-
-
$665
-
-
-
-
$668
$795
-
-
The Black & Whites
N/A
Avg. Price
Past 12 months
Past 12 months
-
-
-
$475,000
-
-
-
-
-
$775,000
$1,236,000
-
$399,000
-
-
-
-
$735,000
$477,000
-
-
The Black & Whites
N/A
Median Price
Past 12 months
Past 12 months
-
-
-
$475,000
-
-
-
-
-
$775,000
$1,236,000
-
$399,000
-
-
-
-
$735,000
$477,000
-
-
The Black & Whites
N/A
Avg. Price / ft2
Past 12 months
Past 12 months
-
-
-
-
-
-
-
-
-
-
-
-
-
-
-
-
-
-
-
-
-
The Black & Whites
N/A
Avg. Price
Past 12 months
Past 12 months
-
-
-
-
-
-
-
-
-
-
-
-
-
-
-
-
-
-
-
-
-
The Black & Whites
N/A
Median Price
Past 12 months
Past 12 months
-
-
-
-
-
-
-
-
-
-
-
-
-
-
-
-
-
-
-
-
-
The Black & Whites
N/A
Avg. Price / ft2
Past 12 months
Past 12 months
-
-
-
-
-
-
-
-
-
-
-
-
$665
-
-
-
-
-
$795
-
-
The Black & Whites
N/A
Avg. Price
Past 12 months
Past 12 months
-
-
-
$475,000
-
-
-
-
-
$450,000
-
-
$399,000
-
-
-
-
-
$477,000
-
-
The Black & Whites
N/A
Median Price
Past 12 months
Past 12 months
-
-
-
$475,000
-
-
-
-
-
$450,000
-
-
$399,000
-
-
-
-
-
$477,000
-
-
The Black & Whites
N/A
Avg. Price / ft2
Past 12 months
Past 12 months
-
-
-
-
-
-
-
-
-
-
-
-
-
-
-
-
-
$668
-
-
-
The Black & Whites
N/A
Avg. Price
Past 12 months
Past 12 months
-
-
-
-
-
-
-
-
-
-
-
-
-
-
-
-
-
$735,000
-
-
-
The Black & Whites
N/A
Median Price
Past 12 months
Past 12 months
-
-
-
-
-
-
-
-
-
-
-
-
-
-
-
-
-
$735,000
-
-
-
The Black & Whites
N/A
Avg. Price / ft2
Past 12 months
Past 12 months
-
-
-
-
-
-
-
-
-
-
-
-
-
-
-
-
-
-
-
-
-
The Black & Whites
N/A
Avg. Price
Past 12 months
Past 12 months
-
-
-
-
-
-
-
-
-
$1,100,000
$1,236,000
-
-
-
-
-
-
-
-
-
-
The Black & Whites
N/A
Median Price
Past 12 months
Past 12 months
-
-
-
-
-
-
-
-
-
$1,100,000
$1,236,000
-
-
-
-
-
-
-
-
-
-
The Black & Whites
N/A
Avg. Price / ft2
Past 12 months
Past 12 months
-
-
-
-
-
-
-
-
-
-
-
-
-
-
-
-
-
-
-
-
-
The Black & Whites
N/A
Avg. Price
Past 12 months
Past 12 months
-
-
-
-
-
-
-
-
-
-
-
-
-
-
-
-
-
-
-
-
-
The Black & Whites
N/A
Median Price
Past 12 months
Past 12 months
-
-
-
-
-
-
-
-
-
-
-
-
-
-
-
-
-
-
-
-
-
The Black & Whites
N/A
Avg. Price / ft2
Past 12 months
Past 12 months
-
-
-
-
-
-
-
-
-
-
-
-
-
-
-
-
-
-
-
-
-
The Black & Whites
N/A
Avg. Price
Past 12 months
Past 12 months
-
-
-
-
-
-
-
-
-
-
-
-
-
-
-
-
-
-
-
-
-
The Black & Whites
N/A
Median Price
Past 12 months
Past 12 months
-
-
-
-
-
-
-
-
-
-
-
-
-
-
-
-
-
-
-
-
-


 6sqft delivers the latest on real estate, architecture, and design, straight from New York City.
