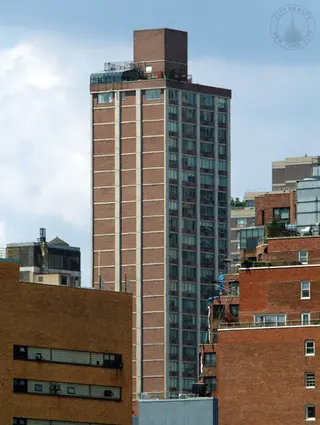
The Fontaine, 353 East 72nd Street - Lenox Hill
- Apartments
- Overview & Photos
- Maps
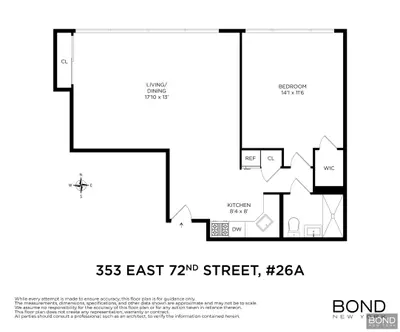
- Floorplans
- Sales Data & Comps
- Similar Buildings
- All Units
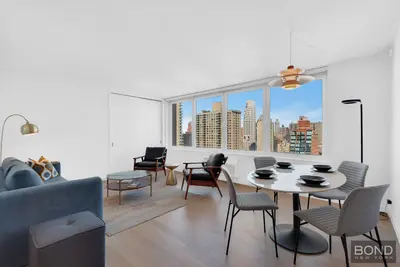
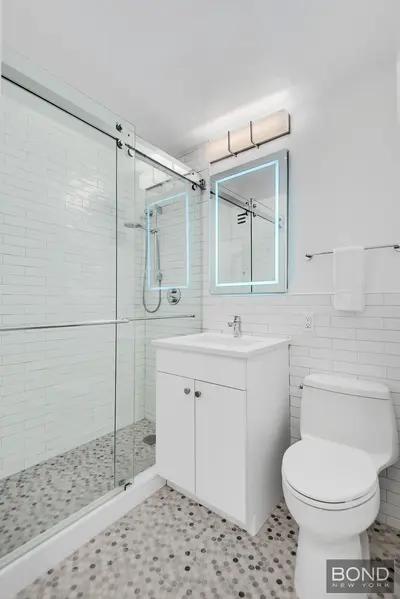
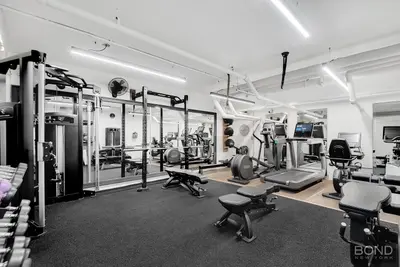
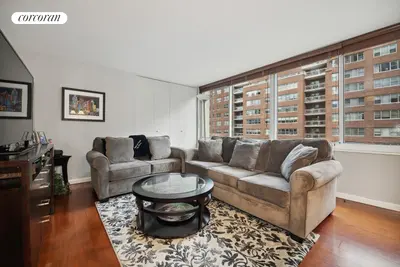
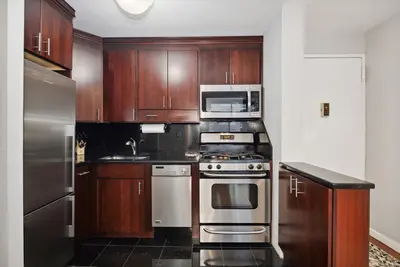
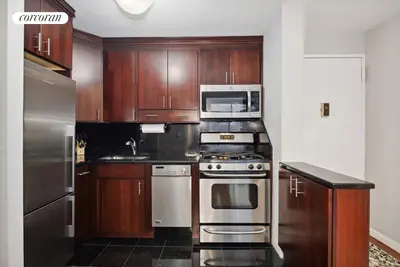
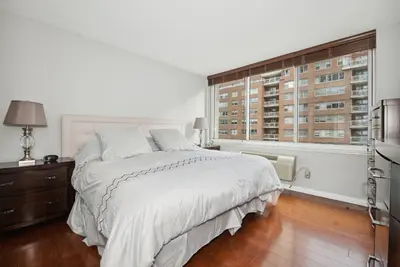

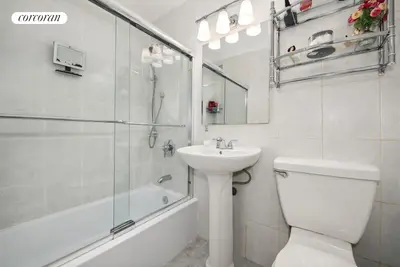
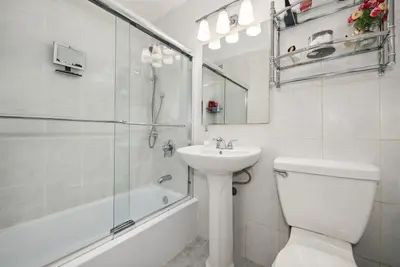
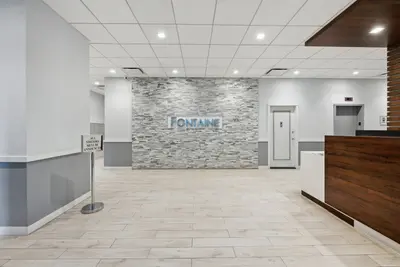
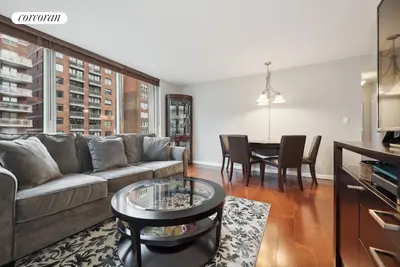
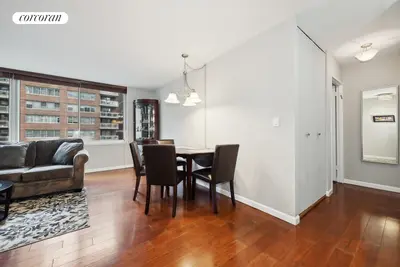
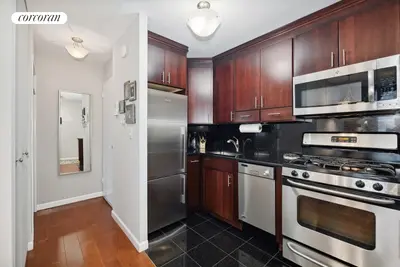
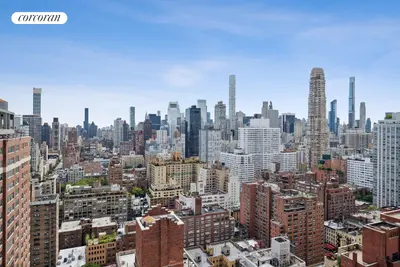
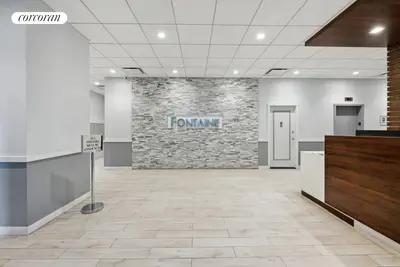
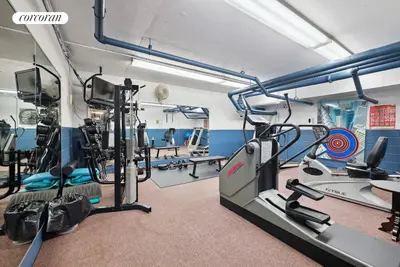
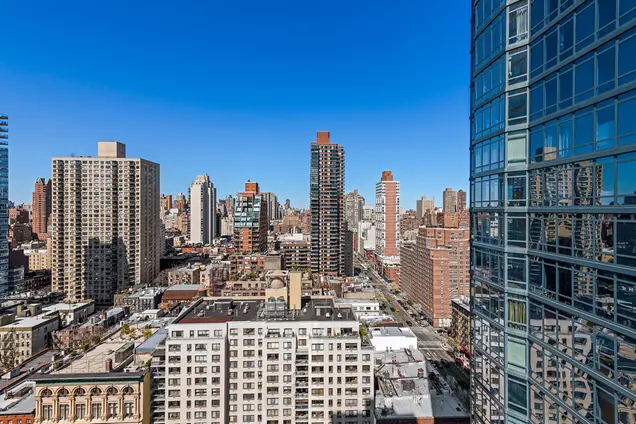
The Fontaine is a full-service cooperative with 24-hour concierge service, a central laundry room, a fitness center, a bike room, and roof deck with city views. It is located at 353 East 72nd Street near several restaurants, grocery stores, and other services and conveniences. Nearby transportation options include the 72nd Street stop on the Second Avenue subway, the M72 bus, and the M15 bus.

View school info, local attractions, transportation options & more.
Experience amazing 3D aerial maps and fly throughs.
For some co-ops, instead of price per square foot, we use an estimate of the number of rooms for each sold apartment to chart price changes over time. This is because many co-op listings do not include square footage information, and this makes it challenging to calculate accurate square-foot averages.
By displaying the price per estimated room count, we are able to provide a more reliable and consistent metric for comparing sales in the building. While we hope that this gives you a clearer sense of price trends in the building, all data should be independently verified. All data provided are only estimates and should not be used to make any purchase or sale decision.
Broker & Buyer Comments