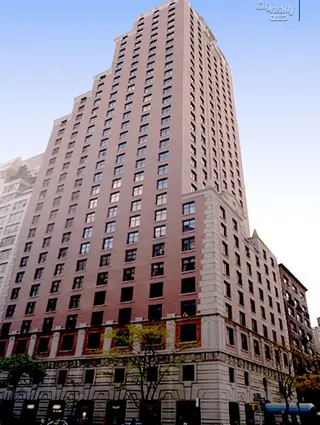
The Trafalgar House, 188 East 70th Street: Sales Summary
at The Southwest corner of Third Avenue Building Profile
All Sales
$1,697
Avg. Price / ft2
Past 12 months, based on 5 sales
$2,164,000
Avg. Price -
Past 12 months, based on 5 sales
$1,798
Median Price / ft2
Past 12 months, based on 5 sales
$2,425,000
Median Price
Past 12 months, based on 5 sales
Year
Avg Price / Ft2
Median Price / Ft2
Avg. Actual Price
Med. Actual Price
Transactions
2025
$1,383
$1,840,000
$1,383
$1,840,000
1
2024
$1,776
$2,245,000
$1,848
$2,475,000
4
2023
$1,578
$1,521,667
$1,578
$1,385,000
3
2022
$1,474
$1,150,000
$1,477
$1,225,000
4
2021
$1,227
$1,486,750
$1,219
$1,575,000
6
2020
$1,402
$1,700,000
$1,362
$1,825,000
3
2019
$1,396
$1,526,667
$1,416
$1,580,000
6
2018
$1,384
$1,764,286
$1,325
$1,850,000
7
2017
$1,442
$1,478,500
$1,384
$1,622,000
4
2016
$1,853
$2,187,500
$1,853
$2,187,500
2
2015
$1,860
$2,697,500
$1,918
$2,725,000
4
2014
$1,511
$1,859,375
$1,550
$1,850,000
8
2013
-
-
-
-
0
Year
Avg Price / Ft2
Median Price / Ft2
Avg. Actual Price
Med. Actual Price
Transactions
2012
$1,505
$1,947,857
$1,578
$1,860,000
7
2011
$1,382
$1,887,500
$1,382
$1,887,500
1
2010
$1,339
$1,670,000
$1,261
$1,590,000
3
2009
$1,400
$1,898,000
$1,221
$1,750,000
5
2008
$1,438
$2,300,900
$1,438
$2,300,900
1
2007
$1,280
$1,592,900
$1,291
$1,650,000
10
2006
$1,039
$913,250
$1,061
$892,500
4
2005
$1,095
$1,189,375
$1,029
$1,082,500
8
2004
$1,033
$1,255,385
$939
$1,100,000
13
2003
$898
$1,080,808
$860
$1,099,995
16
The Breakdown of All Sales by Apartment Size