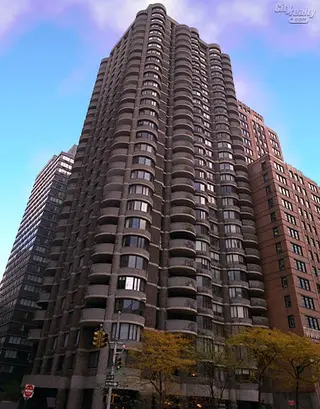
Lincoln Plaza Towers, 44 West 62nd Street - Upper West Side
- Apartments
- Overview & Photos
- Maps
- Floorplans
- Sales Data & Comps
- Similar Buildings
- All Units


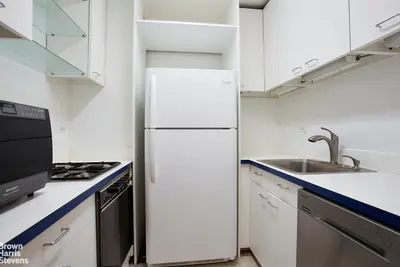
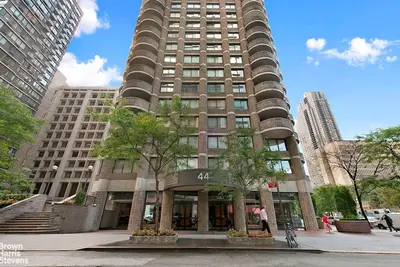

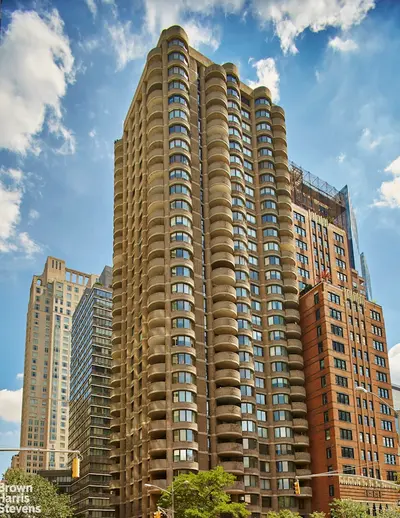
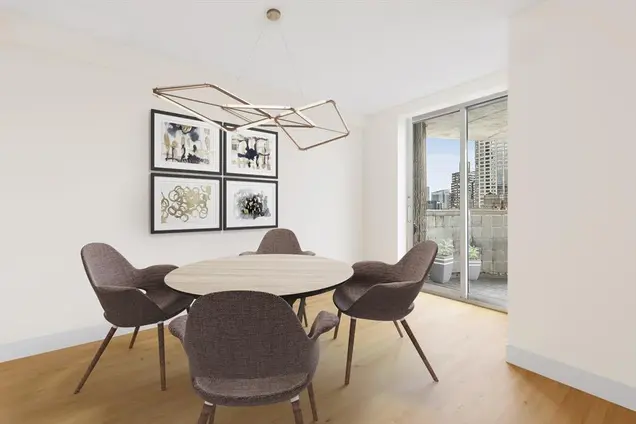
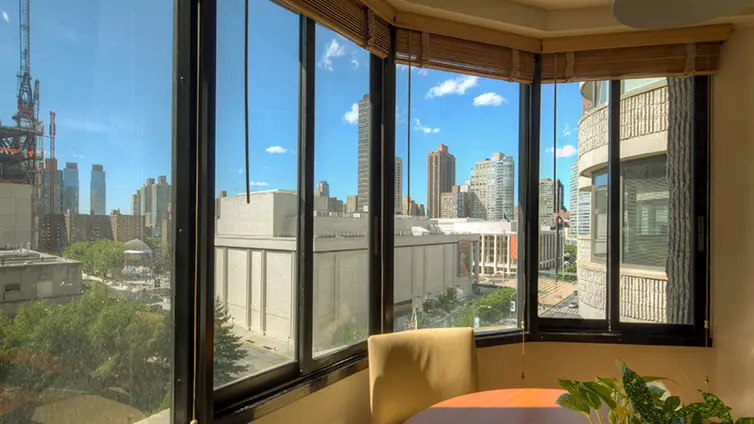
Lincoln Plaza Towers is a 31-story, 158-unit postwar cooperative situated between Broadway and Columbus Avenue at 44 West 62nd Street. The full-service building has a circular driveway, a grand attended lobby, a fitness area, a community room, a central laundry room, a bike room, and residential storage. A garage with valet parking offers owners a discount. The location allows for easy access to Central Park, Columbus Circle, Lincoln Center, Nordstrom, top Upper West Side and Midtown West restaurants, and public transportation.
Maintenance fees include gas, standard cable, Showtime, and HBO. Pets and pied-a-terres are welcome.


View school info, local attractions, transportation options & more.
Experience amazing 3D aerial maps and fly throughs.
For some co-ops, instead of price per square foot, we use an estimate of the number of rooms for each sold apartment to chart price changes over time. This is because many co-op listings do not include square footage information, and this makes it challenging to calculate accurate square-foot averages.
By displaying the price per estimated room count, we are able to provide a more reliable and consistent metric for comparing sales in the building. While we hope that this gives you a clearer sense of price trends in the building, all data should be independently verified. All data provided are only estimates and should not be used to make any purchase or sale decision.