Lincoln Spencer Arms, 140 West 69th Street - Upper West Side
- Apartments
- Overview & Photos
- Maps
- Floorplans
- Sales Data & Comps
- Similar Buildings
- All Units
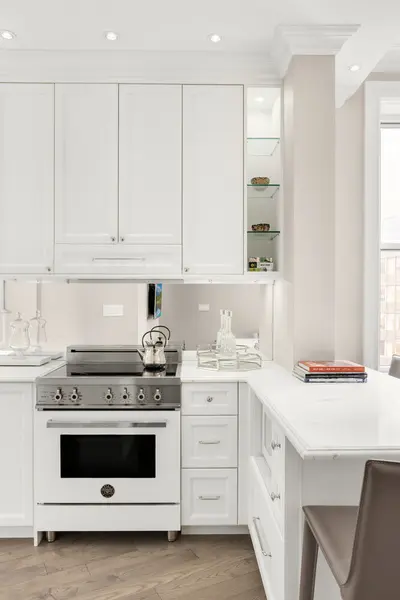
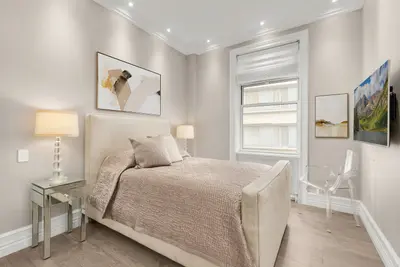
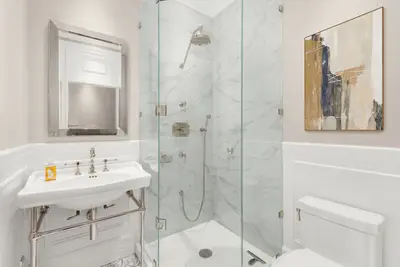
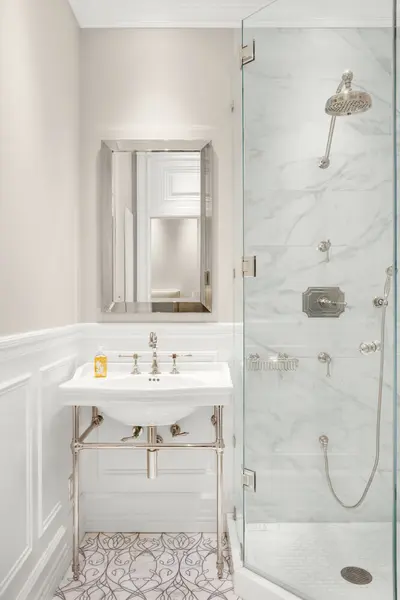

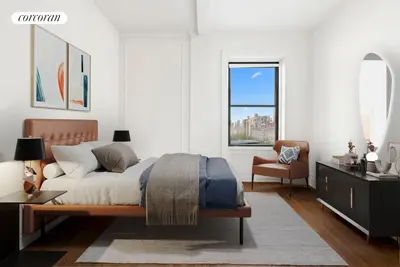
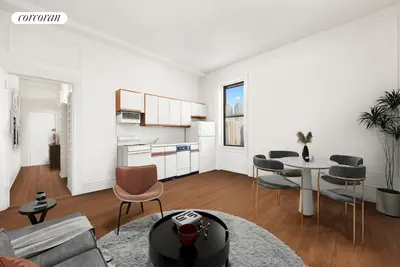
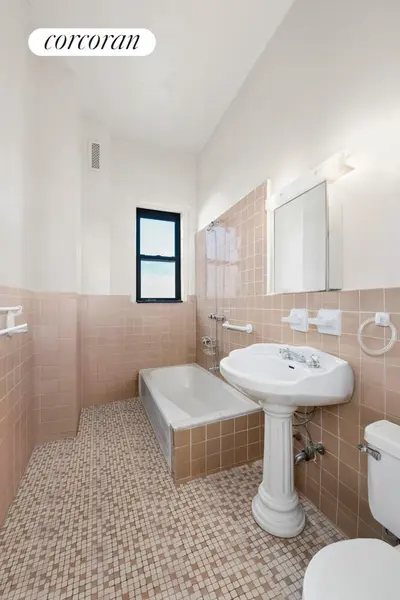
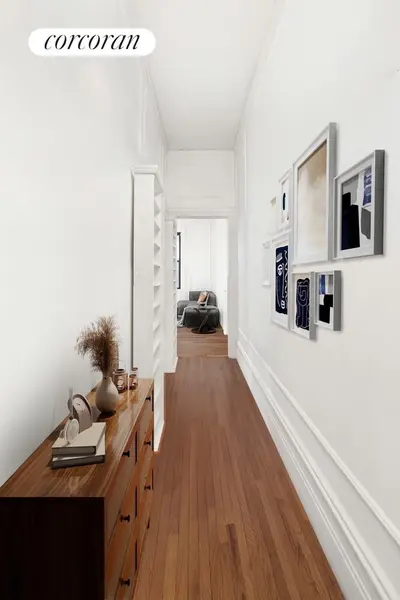
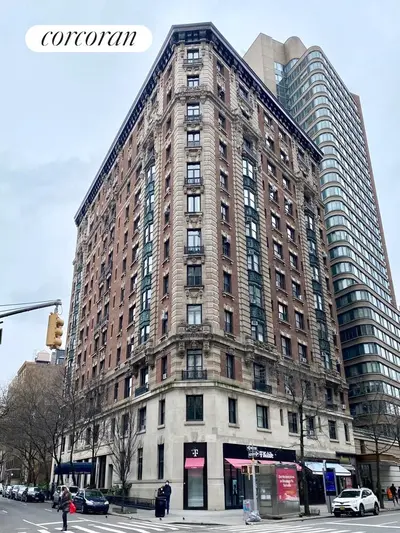


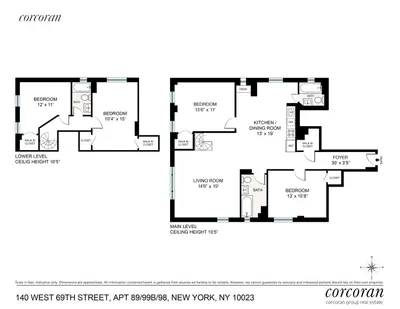
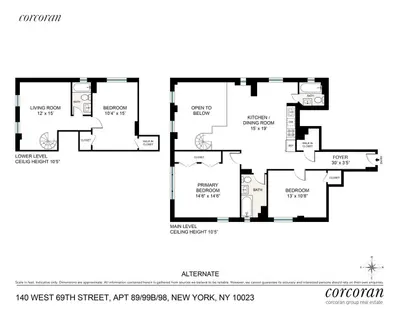


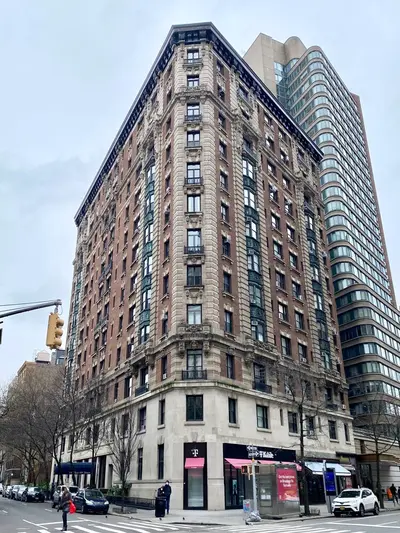
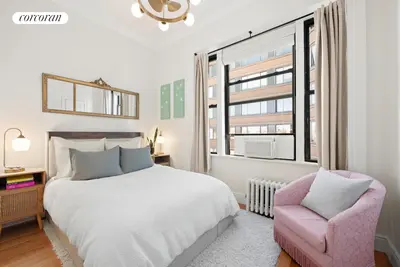
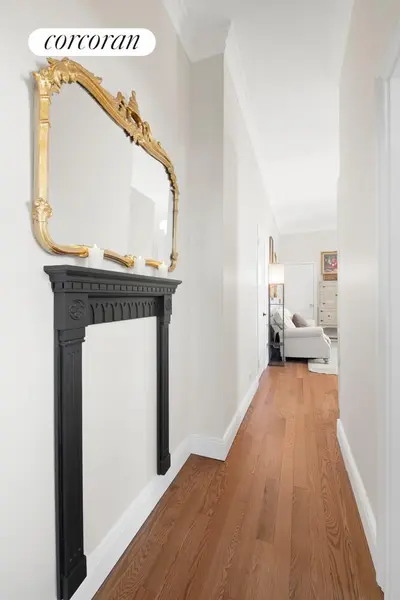


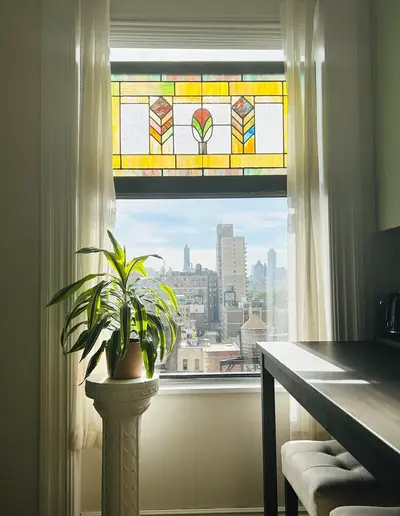


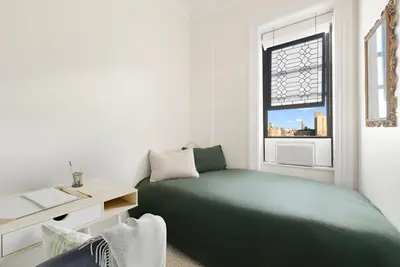
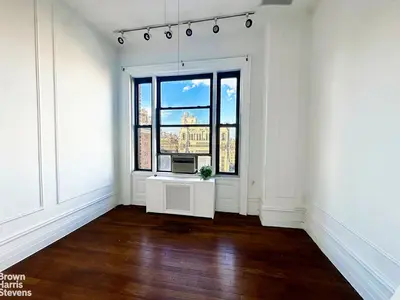
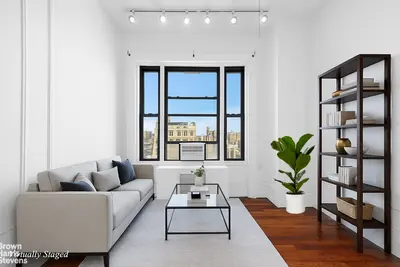
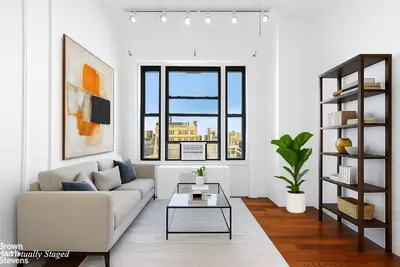
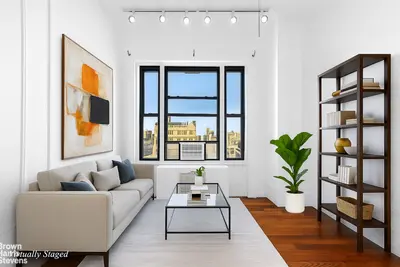
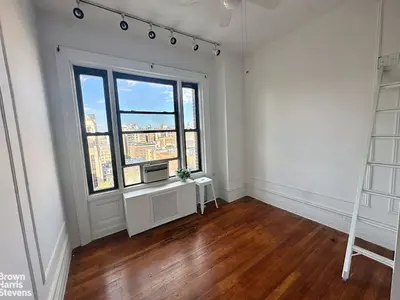

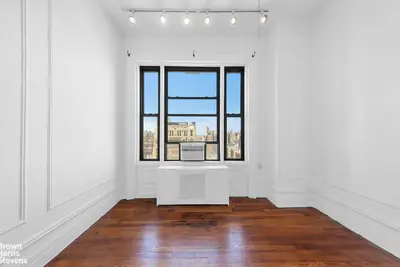
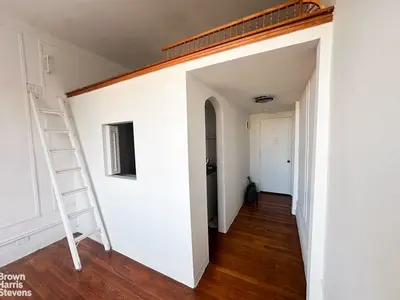
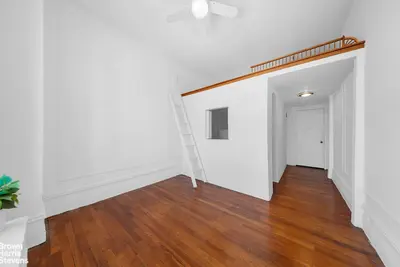
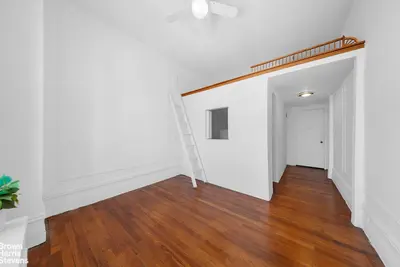
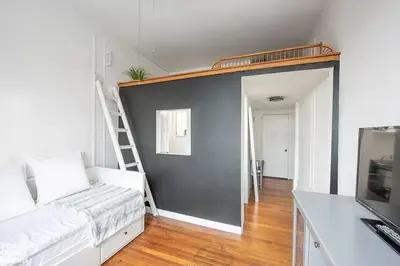


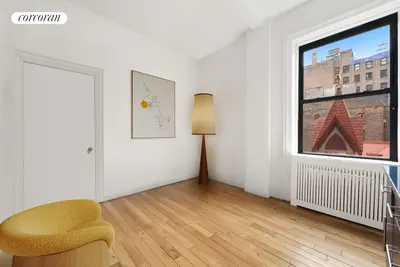
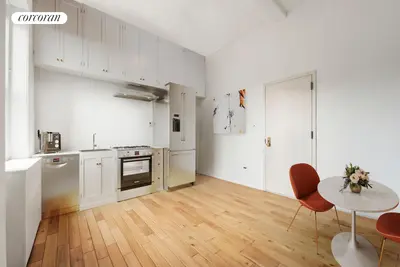

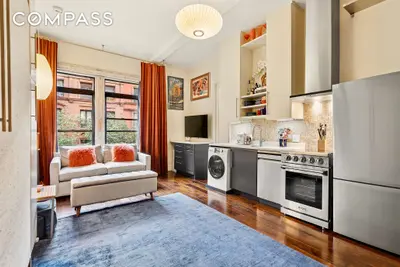
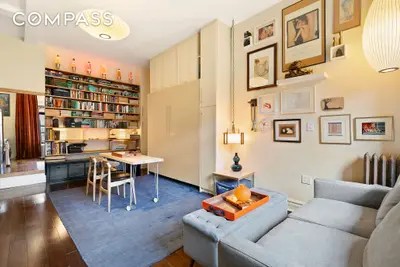
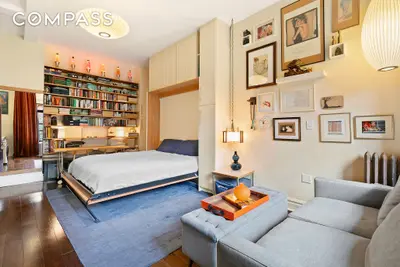

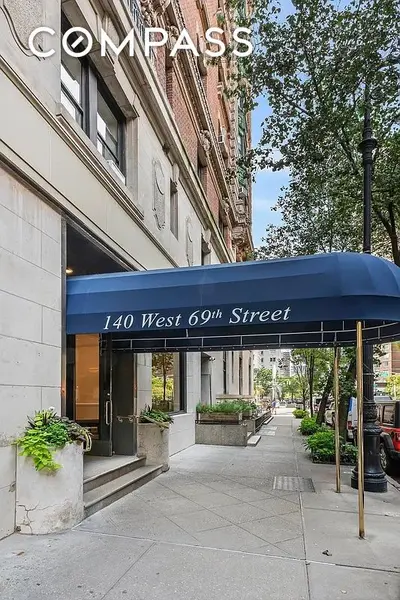


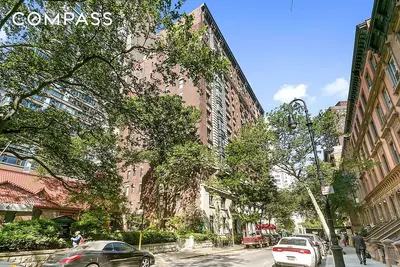


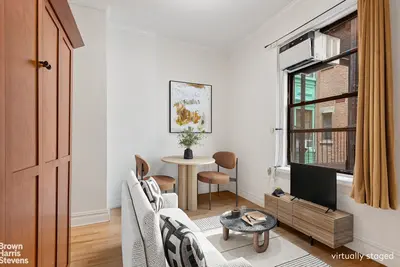
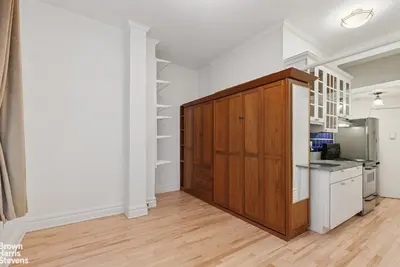
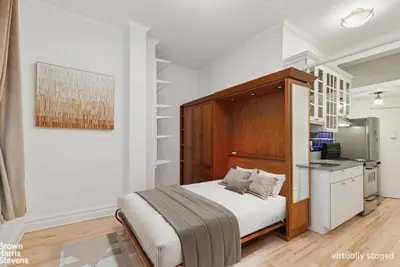
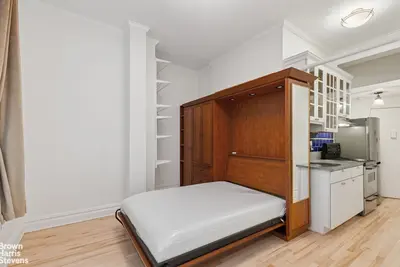
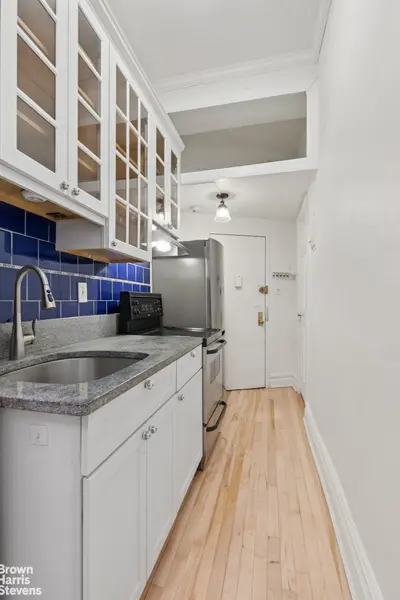


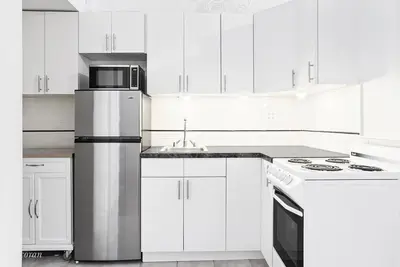
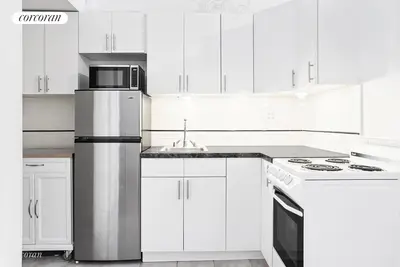


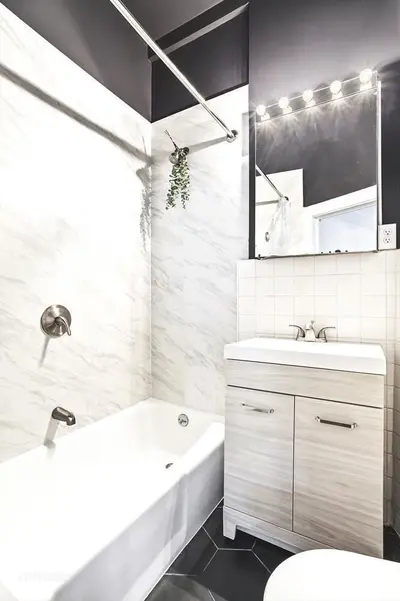
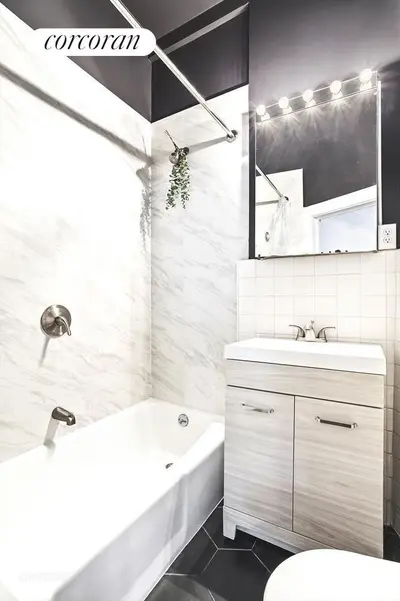


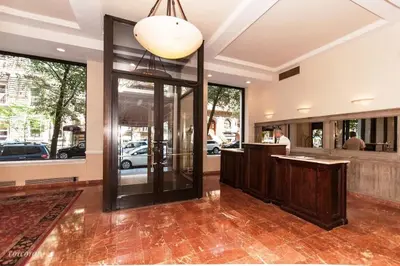


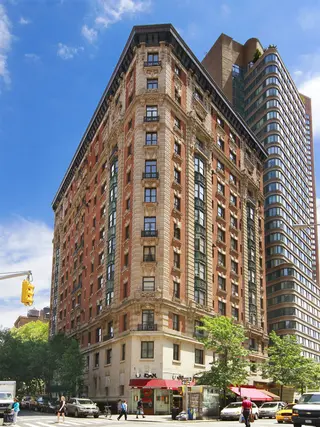
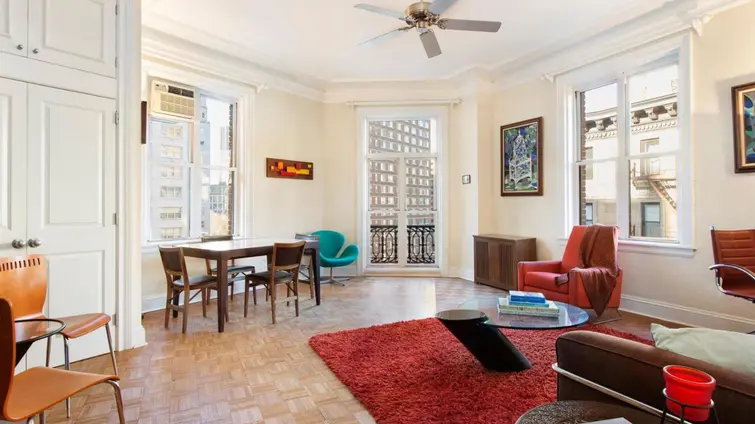
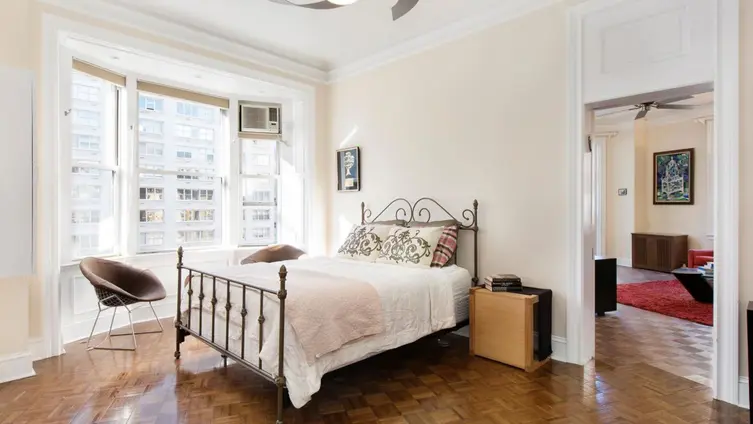
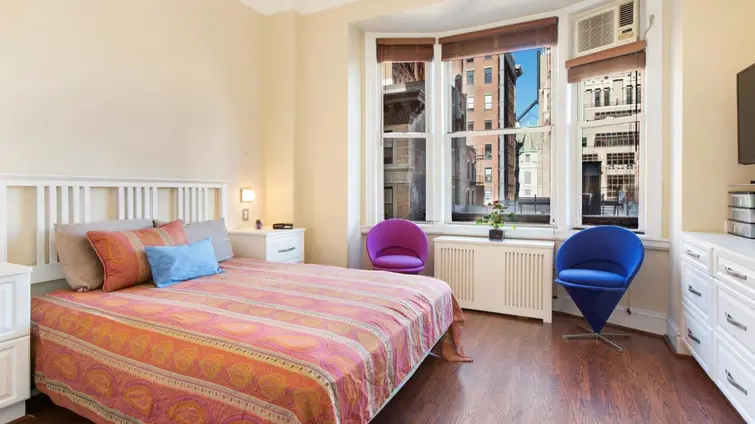
The Lincoln Spencer Arms, originally built in 1903 as the Spencer Arms Hotel, is a distinguished 12-story Beaux-Arts cooperative at 140 West 69th Street. The building features 237 units and was converted to co-op in 1986. Its architectural details include a chamfered corner at Broadway, ornate bandcourses, bay windows, wrought-iron balconies, and a prominent cornice, with many apartments featuring soaring 10.5-foot ceilings.
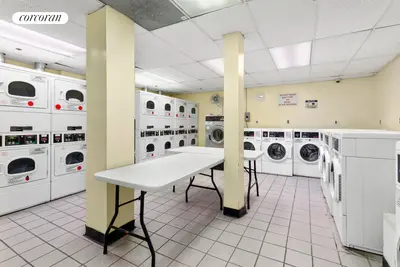
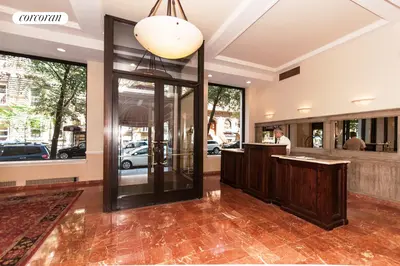
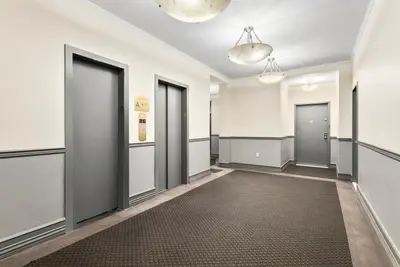
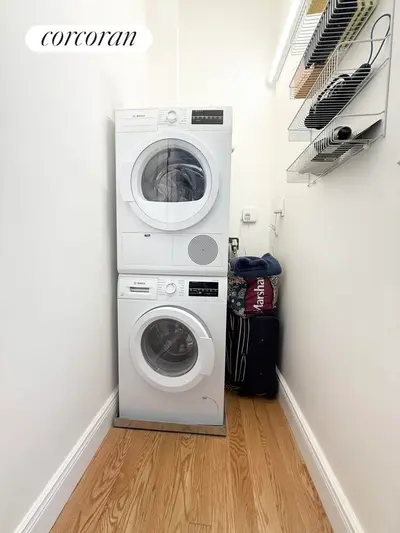
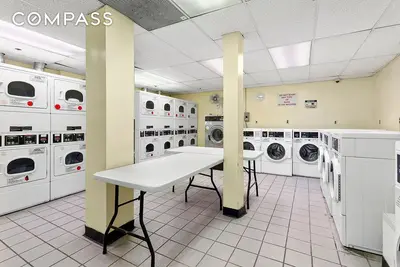
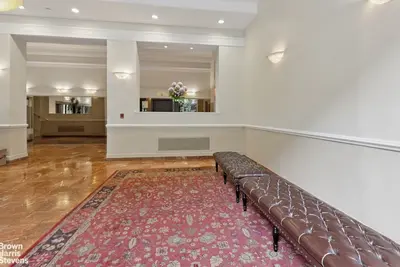
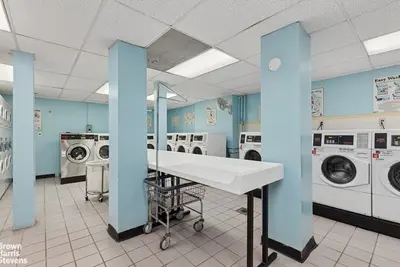
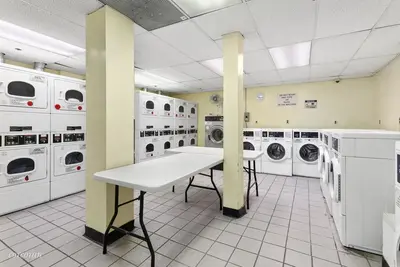
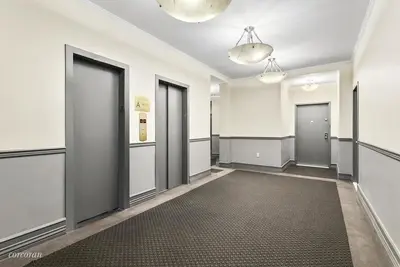
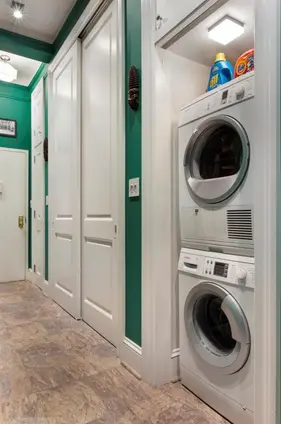
The building stands as the only full-service doorman property on this landmark brownstone block, offering 24-hour door staff, a live-in superintendent, and central laundry facilities. The co-op maintains a flexible policy allowing pied-à-terres, co-purchasing, and subletting after 5 years of residency, with pet ownership permitted under certain restrictions.
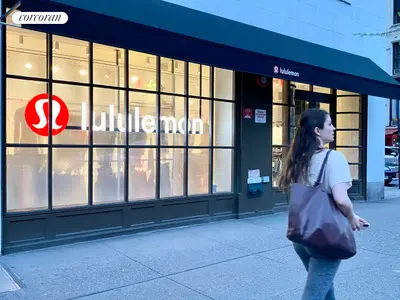
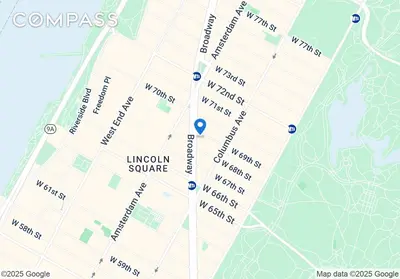
Positioned at the corner of Broadway and West 69th Street, the building sits in a prime Upper West Side location near Lincoln Center for the Performing Arts. Residents enjoy easy access to Central Park, multiple subway lines (1/2/3/B/C), and abundant shopping and dining options along Columbus Avenue.
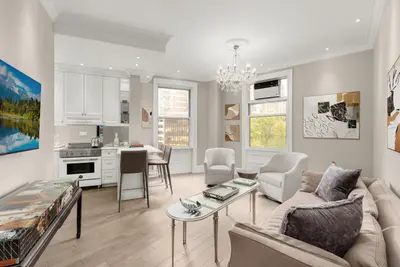
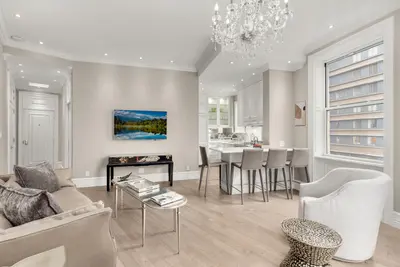
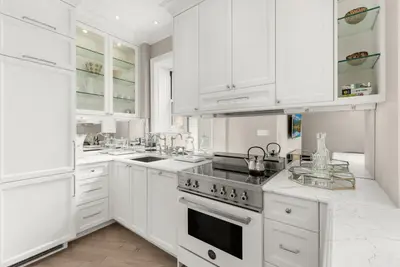
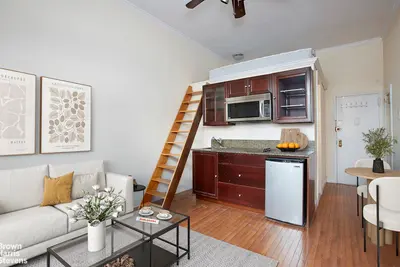
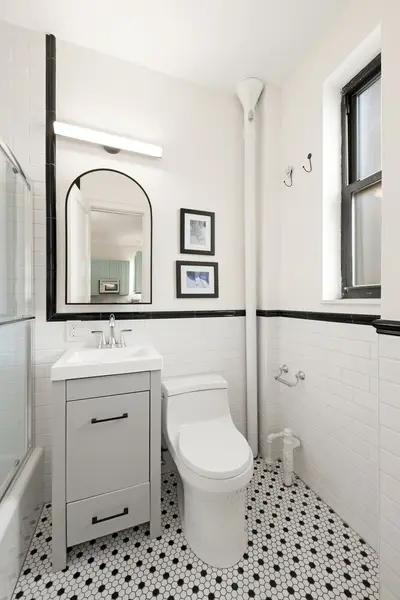
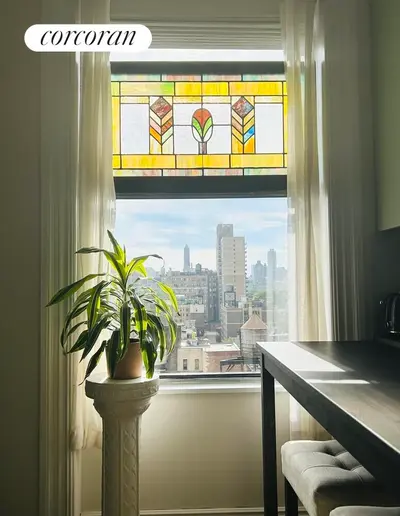
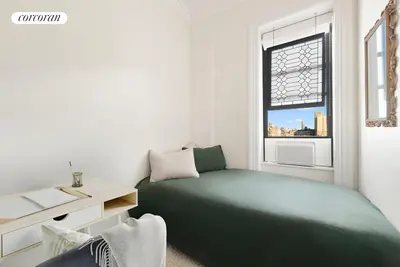
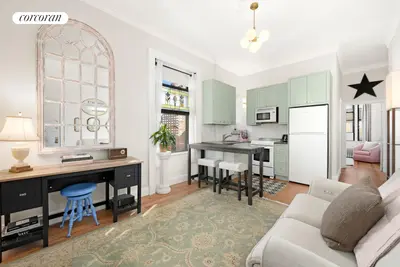
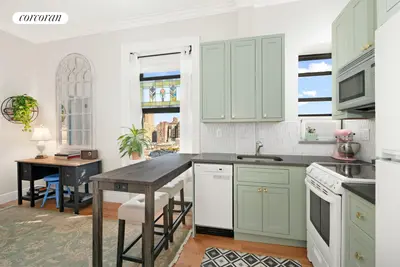
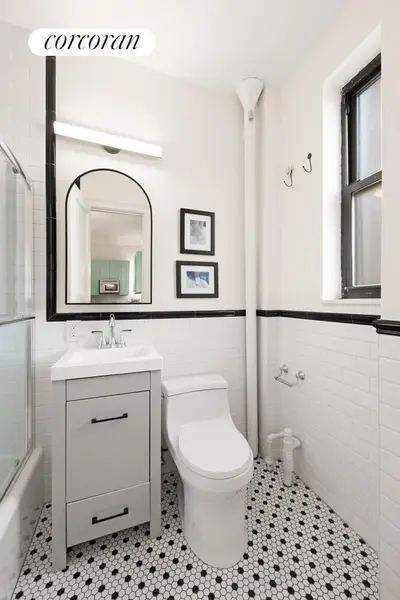
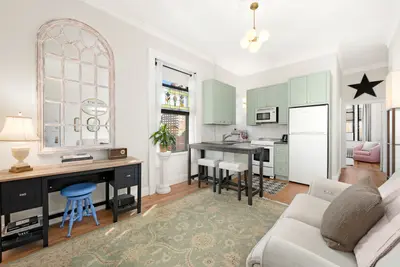
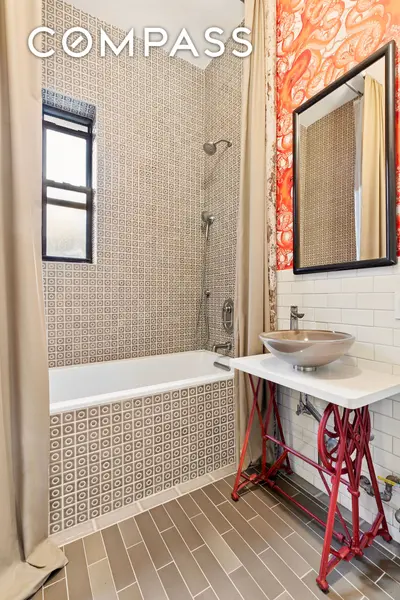
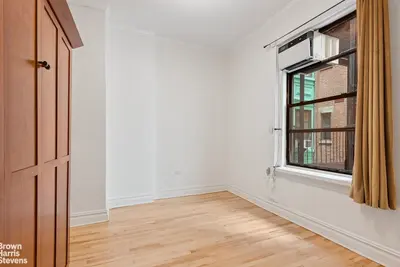
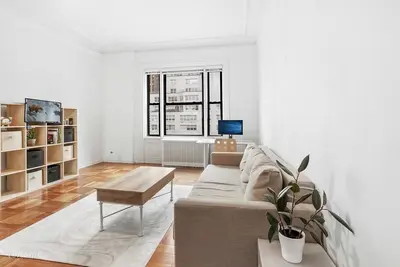
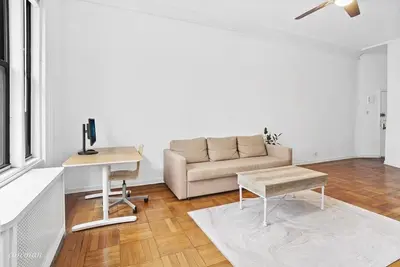
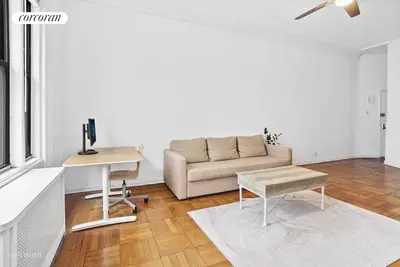
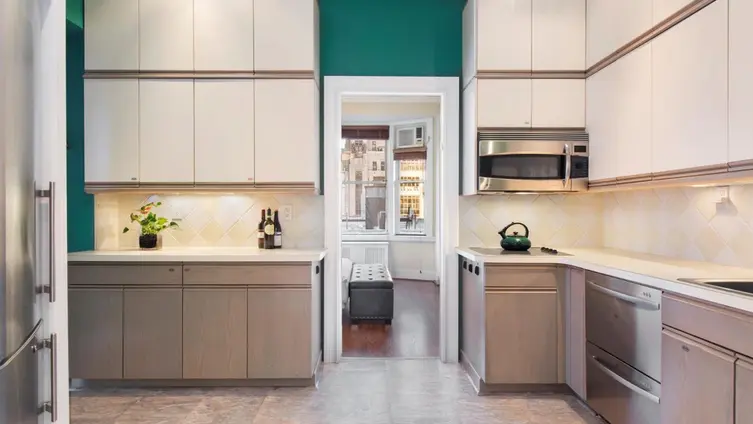
The pre-war structure retains much of its original grandeur, with a distinctive two-story stone base and detailed architectural elements throughout. Originally designed with just three large apartments per floor, today's units range from studios to carefully combined larger residences, many maintaining period details while incorporating modern amenities.


View school info, local attractions, transportation options & more.
Experience amazing 3D aerial maps and fly throughs.
For some co-ops, instead of price per square foot, we use an estimate of the number of rooms for each sold apartment to chart price changes over time. This is because many co-op listings do not include square footage information, and this makes it challenging to calculate accurate square-foot averages.
By displaying the price per estimated room count, we are able to provide a more reliable and consistent metric for comparing sales in the building. While we hope that this gives you a clearer sense of price trends in the building, all data should be independently verified. All data provided are only estimates and should not be used to make any purchase or sale decision.


Broker & Buyer Comments