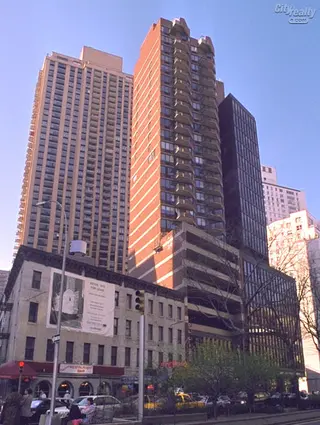
The Bel Canto, 1991 Broadway: Sales Summary
between West 67th Street & West 68th Street Building Profile
All Sales
$1,042
Avg. Price / ft2
Past 12 months, based on 4 sales
$891,750
Avg. Price -
Past 12 months, based on 4 sales
$1,038
Median Price / ft2
Past 12 months, based on 4 sales
$570,500
Median Price
Past 12 months, based on 4 sales
The Breakdown of All Sales by Apartment Size
Studios
$1,057
Avg. Price / ft2 -
Past 12 months, based on 3 sales
$564,000
Avg. Price -
Past 12 months, based on 3 sales
$1,070
Median Price / ft2 -
Past 12 months, based on 3 sales
$565,000
Median Price -
Past 12 months, based on 3 sales
Show More
two Bedrooms
No sales in the past 12 months
No sales in the past 12 months
No sales in the past 12 months
No sales in the past 12 months
Show More
four Bedrooms
No sales in the past 12 months
No sales in the past 12 months
No sales in the past 12 months
No sales in the past 12 months
Show More
one Bedroom
No sales in the past 12 months
No sales in the past 12 months
No sales in the past 12 months
No sales in the past 12 months
Show More
three Bedrooms
$996
Avg. Price / ft2 -
Past 12 months, based on 1 sale
$1,875,000
Avg. Price -
Past 12 months, based on 1 sale
$996
Median Price / ft2 -
Past 12 months, based on 1 sale
$1,875,000
Median Price -
Past 12 months, based on 1 sale
Show More
five Bedrooms
No sales in the past 12 months
No sales in the past 12 months
No sales in the past 12 months
No sales in the past 12 months
Show More

 6sqft delivers the latest on real estate, architecture, and design, straight from New York City.
