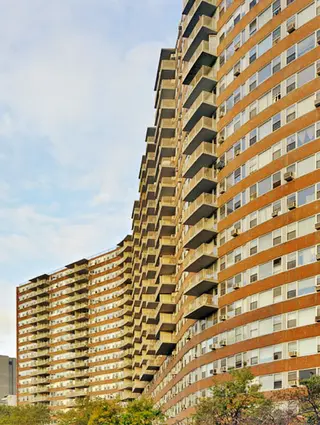
Chatham Green, 165 Park Row - Lower East Side
- Apartments
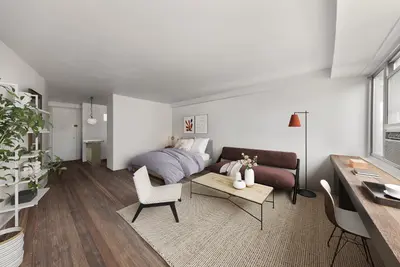
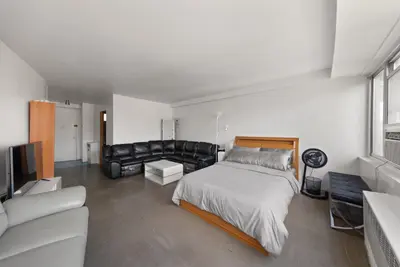
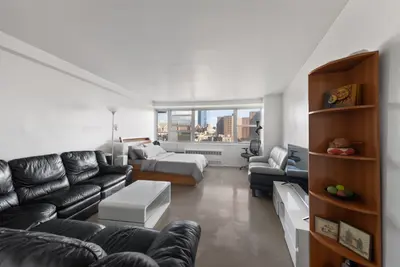
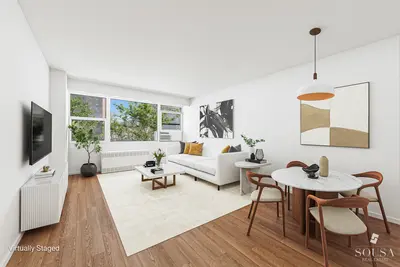
- Overview & Photos
- Maps
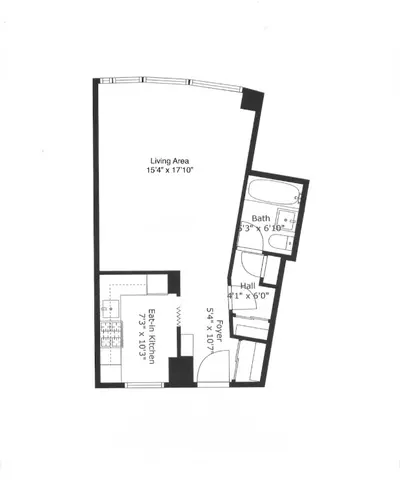
- Floorplans
- Sales Data & Comps
- Similar Buildings
- All Units


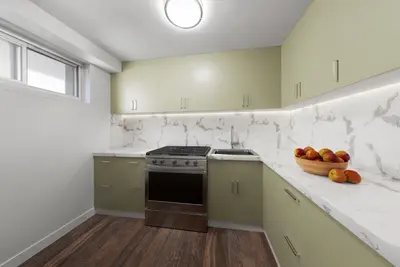

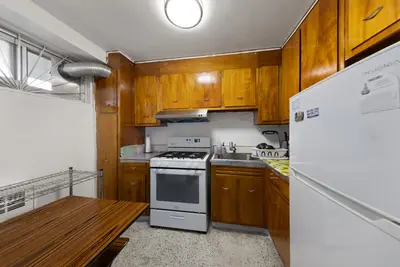
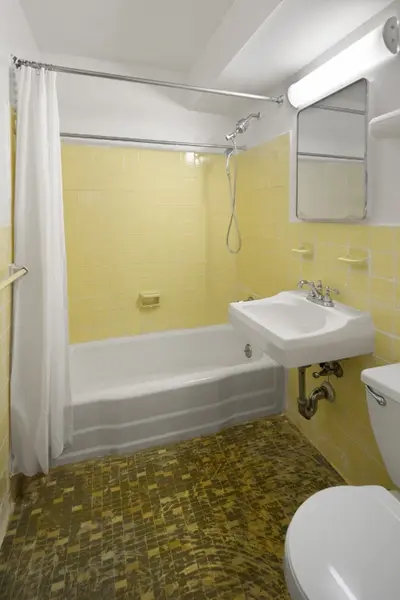

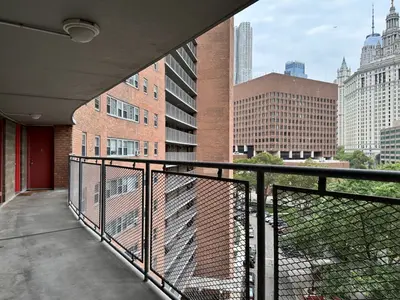

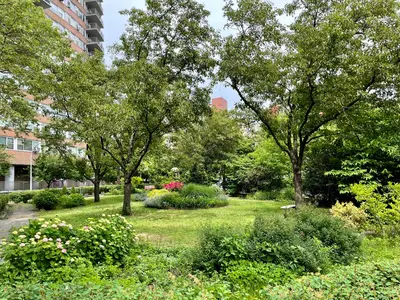
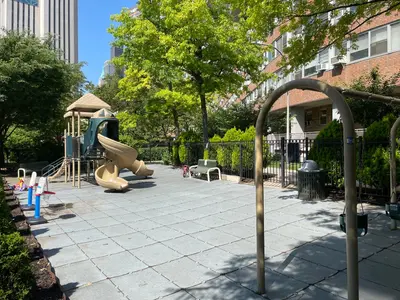
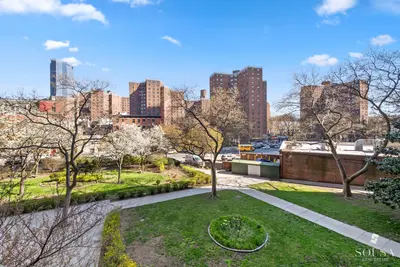
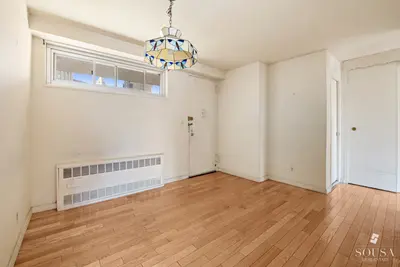


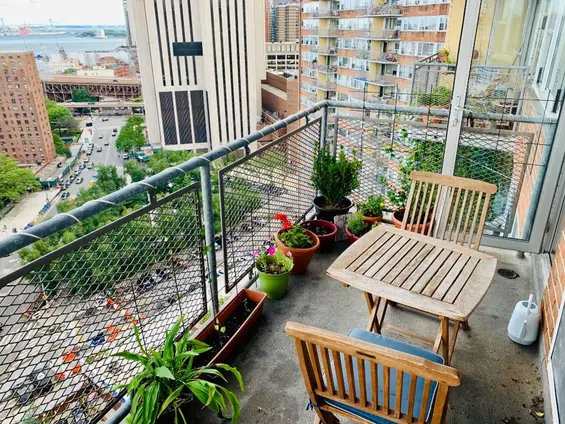
Chatham Green is a cooperative community on the Lower East Side. Sitting on 4.5 acres of green space, the private lawns are open to all residents, and there is a children's playground as well. Additional perks include a central laundry room, on-site parking, 24-hour security booth, and the services of a live-in superintendent. The complex is a 5-minute walk to the 4/5/6 and J/Z stop at Brooklyn Bridge, and a 10-minute walk to the 2/3, N/Q/R/W at Fulton Street, and the B/D at Grand Street. Pets are permitted with board approval.


View school info, local attractions, transportation options & more.
Experience amazing 3D aerial maps and fly throughs.
For some co-ops, instead of price per square foot, we use an estimate of the number of rooms for each sold apartment to chart price changes over time. This is because many co-op listings do not include square footage information, and this makes it challenging to calculate accurate square-foot averages.
By displaying the price per estimated room count, we are able to provide a more reliable and consistent metric for comparing sales in the building. While we hope that this gives you a clearer sense of price trends in the building, all data should be independently verified. All data provided are only estimates and should not be used to make any purchase or sale decision.