Shh... Many units sell without being publicly listed.
Explore off-market possibilities at The Amalgamated Dwellings – inquire to find out about residences with owners open to private offers!
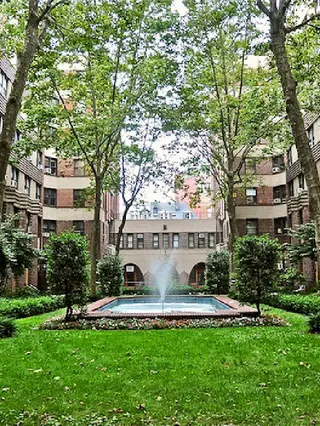

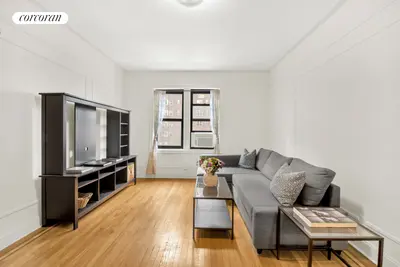

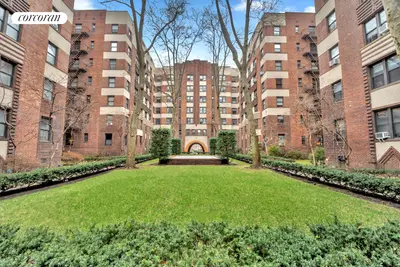
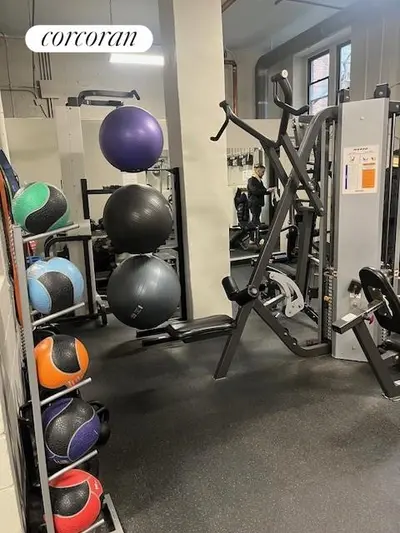
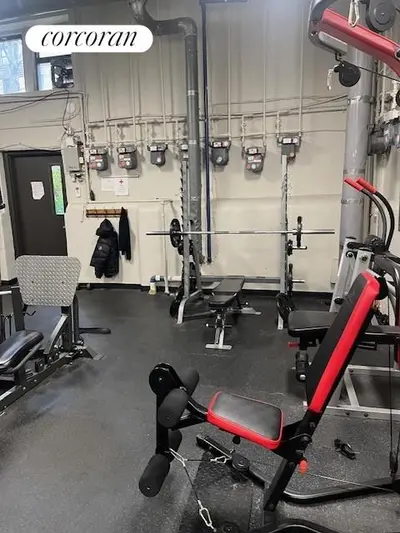
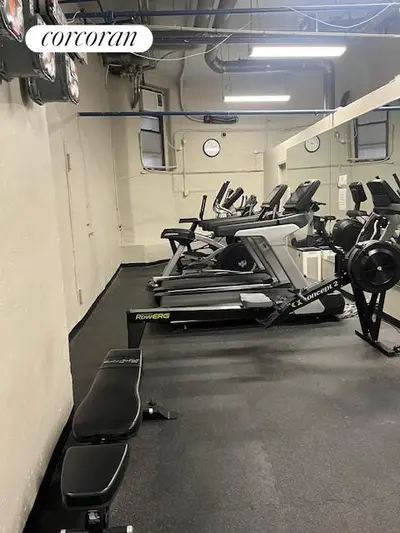
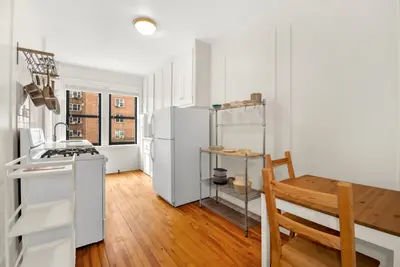
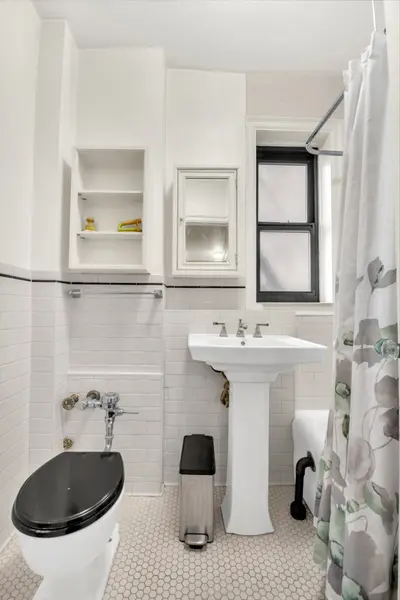
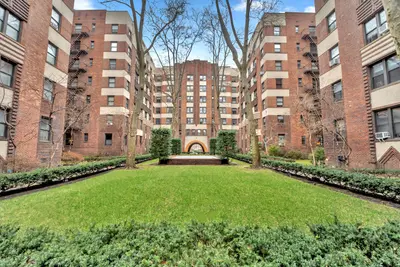
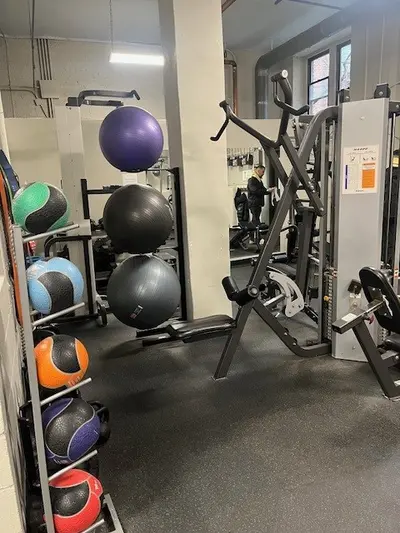
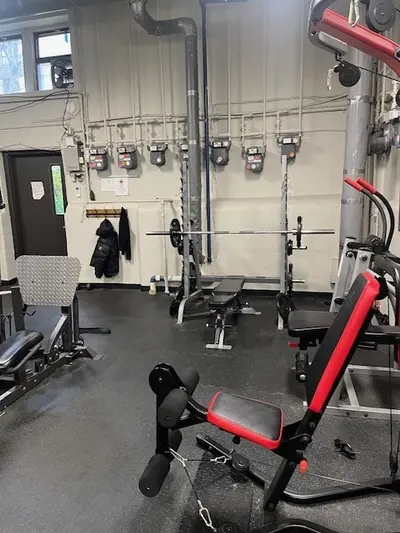
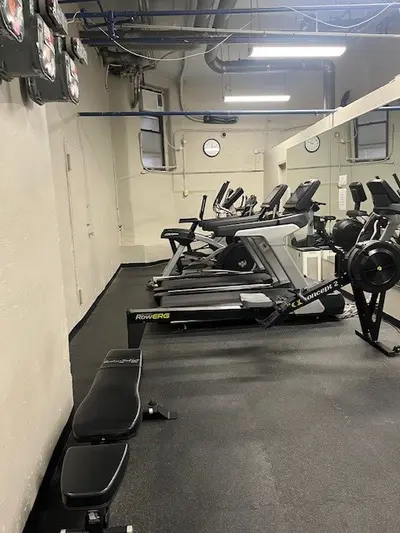
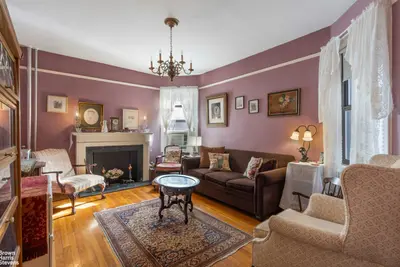
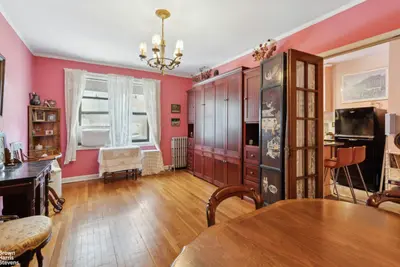
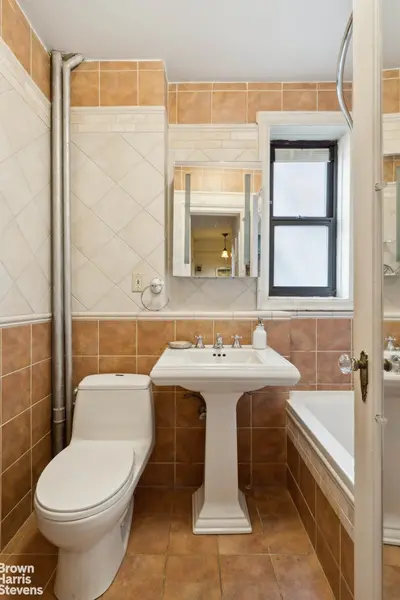
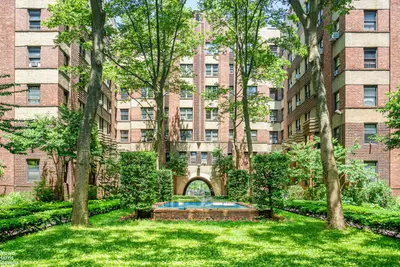


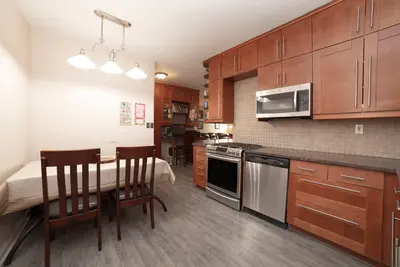
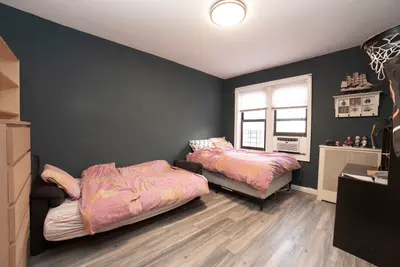
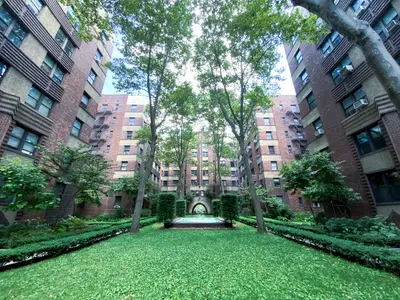
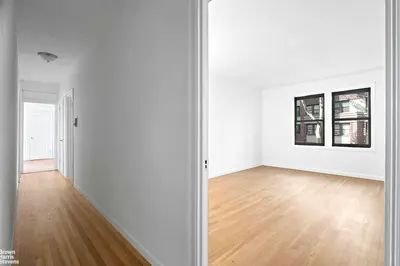
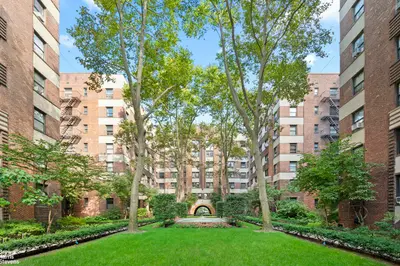
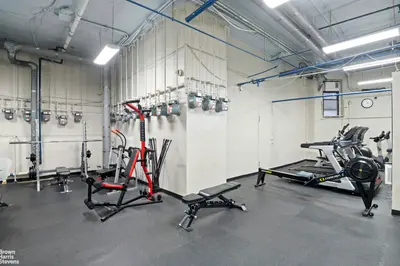


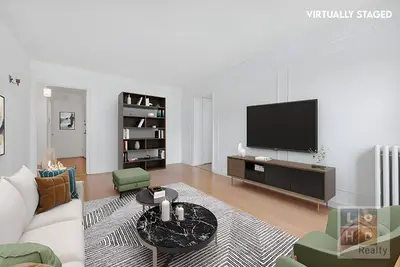
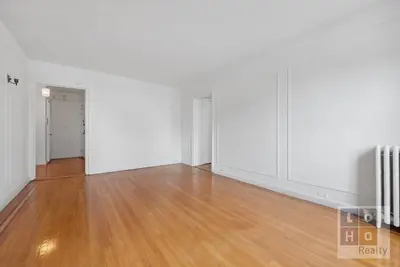

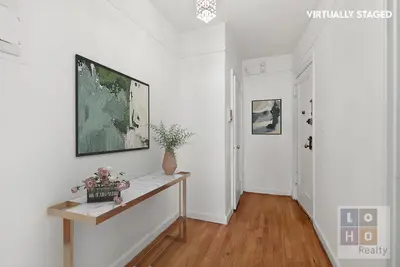

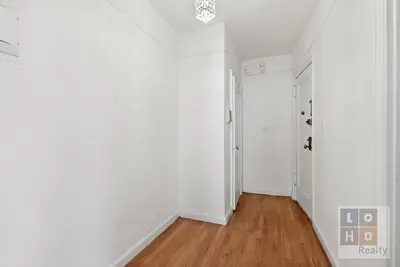

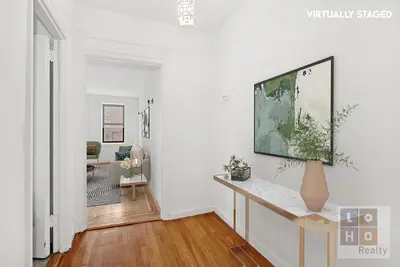


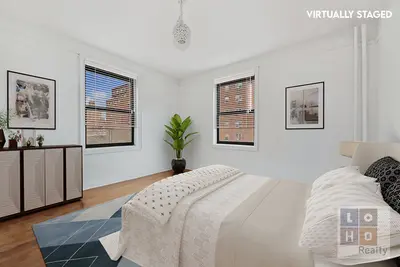
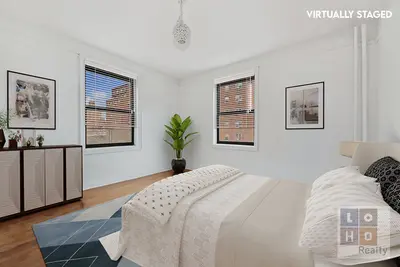


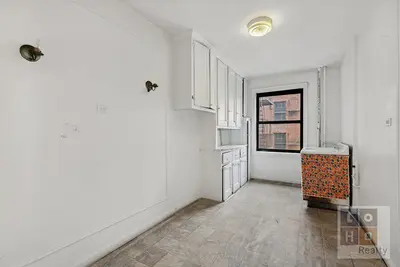


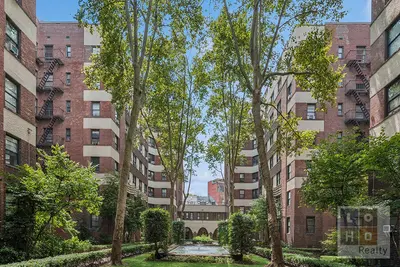


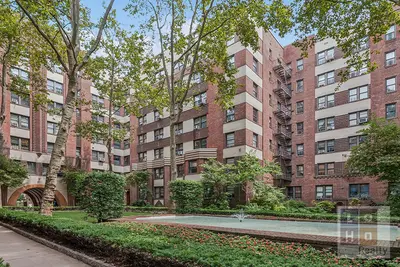
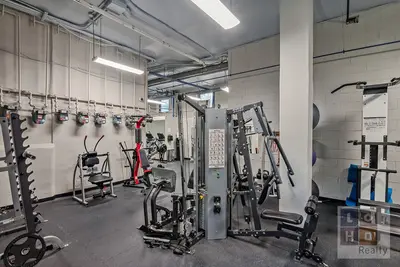


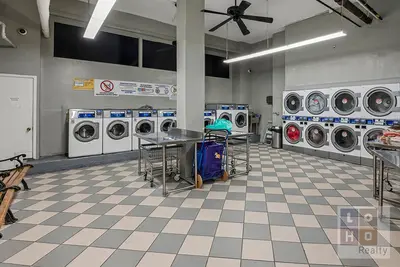
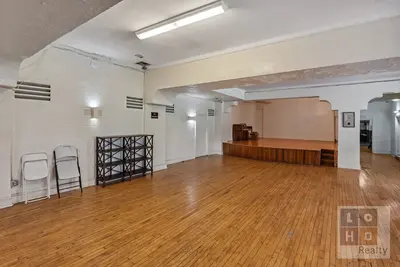


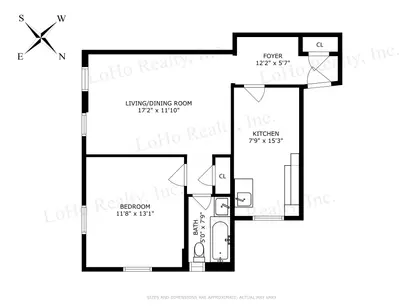
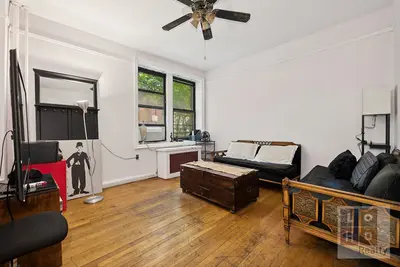
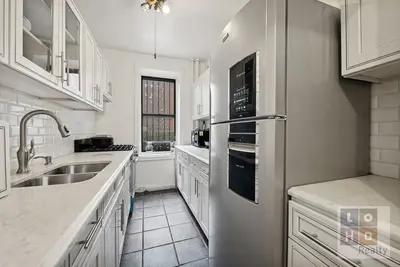


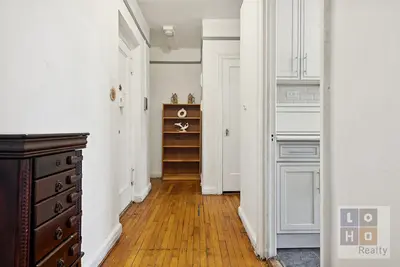

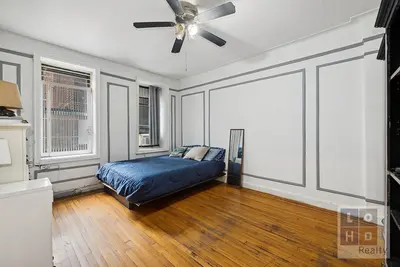
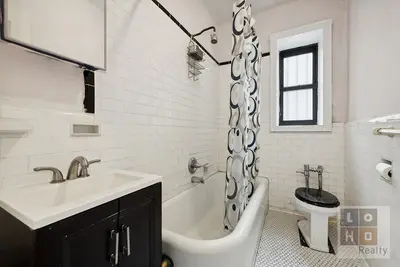

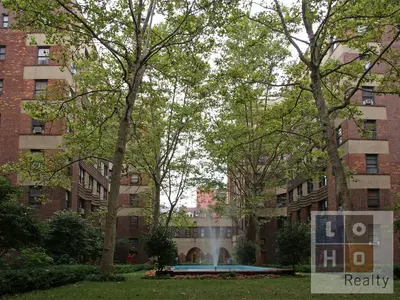

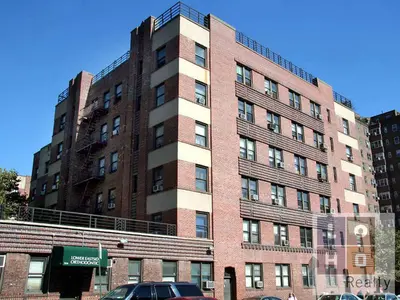

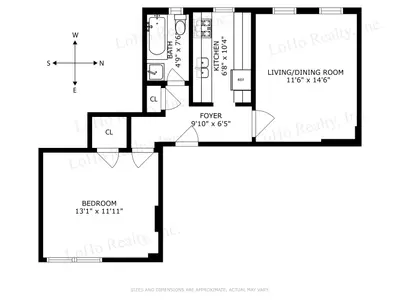

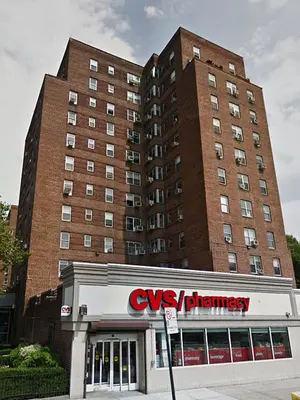
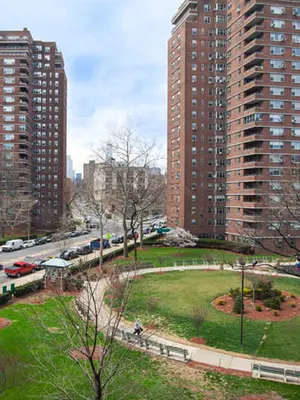
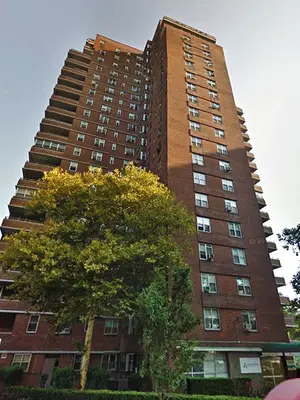
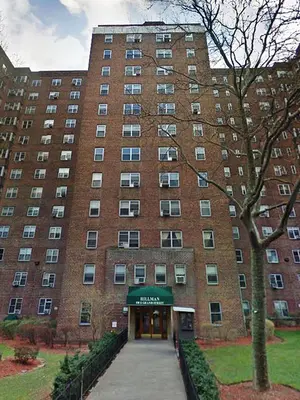
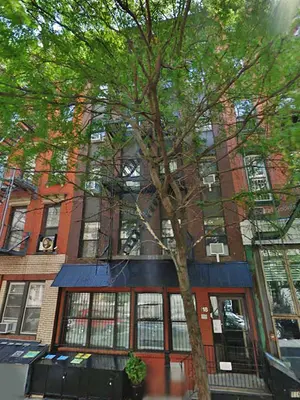
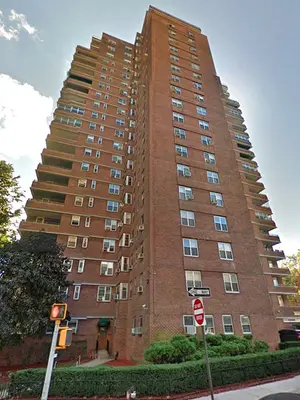
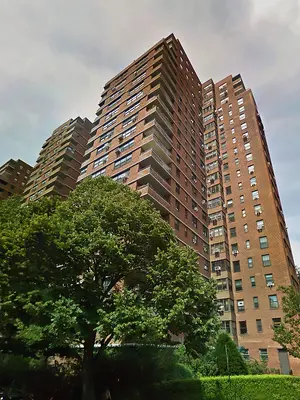
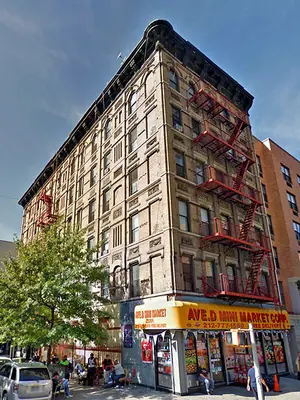
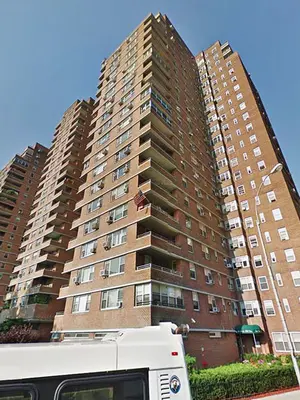
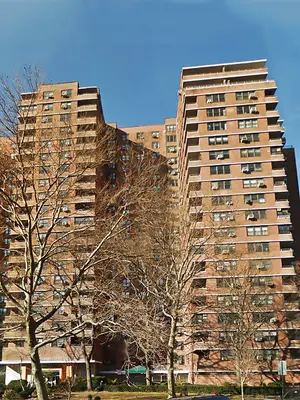
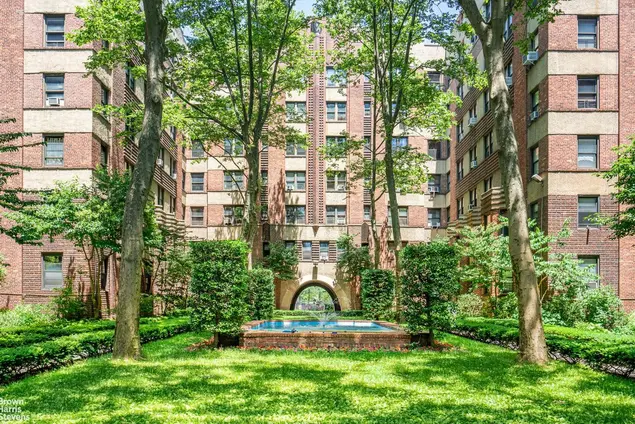
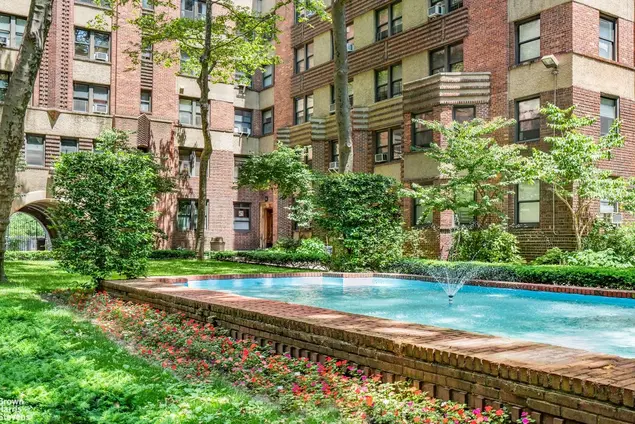
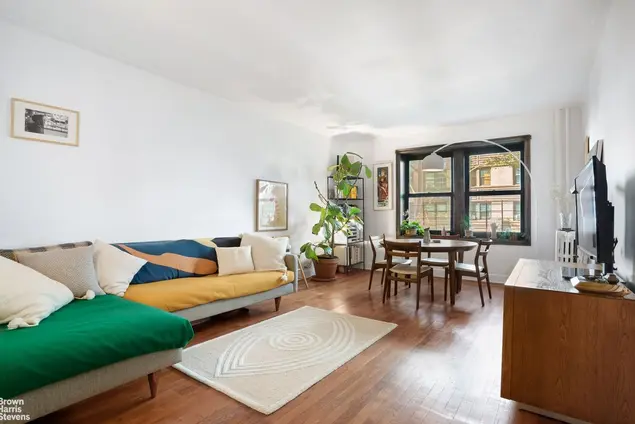
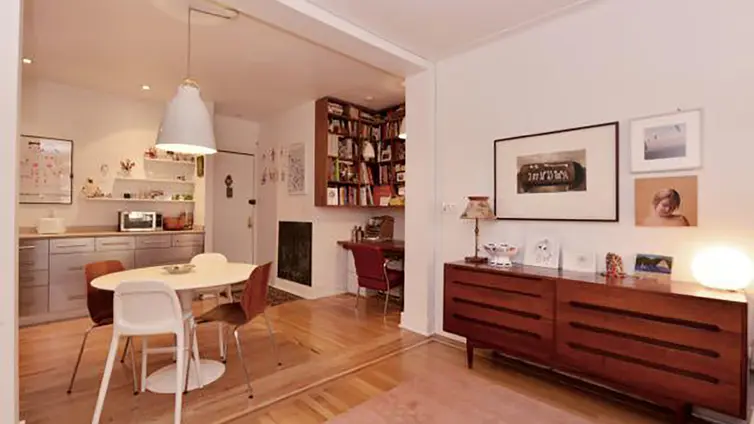
The Amalgamated Dwellings is a pre-war co-op building in downtown Manhattan's Lower East Side neighborhood inspired by pre-war architecture from Vienna and finished in 1929. Situated at 504 Grand Street, between Columbia Street and Willett Street, the building contains 237 units and rises 6 stories. Residential amenities include a lush green courtyard, 24-hour security, package room, live-in superintendent, maintenance staff, laundry room, bike room, and fitness room. It is close to Kiki's, Bacaro, Wu's Wonton, Nakamura, Dimes, Essex Market, Trader Joe's, Clandestino, Forgetmenot, Kopitiam, East River Park, and the newly restored Luther Gulick Park.
Explore off-market possibilities at The Amalgamated Dwellings – inquire to find out about residences with owners open to private offers!

View school info, local attractions, transportation options & more.
Experience amazing 3D aerial maps and fly throughs.
For some co-ops, instead of price per square foot, we use an estimate of the number of rooms for each sold apartment to chart price changes over time. This is because many co-op listings do not include square footage information, and this makes it challenging to calculate accurate square-foot averages.
By displaying the price per estimated room count, we are able to provide a more reliable and consistent metric for comparing sales in the building. While we hope that this gives you a clearer sense of price trends in the building, all data should be independently verified. All data provided are only estimates and should not be used to make any purchase or sale decision.
|
Year
Avg Price / Room (Est)
Avg. Actual Price
Med. Actual Price
Transactions
2025
$155,833
$552,500
2
2024
$225,583
$874,167
6
2023
$200,000
$600,000
5
2022
$211,820
$740,858
17
2021
$234,644
$950,455
11
2020
$213,875
$713,167
3
2019
$232,988
$759,313
8
2018
$209,349
$722,500
10
2017
$202,841
$725,727
11
2016
$198,335
$732,630
10
2015
$181,293
$684,643
7
2014
$151,389
$552,273
11
|
Year
Avg Price / Room (Est)
Avg. Actual Price
Med. Actual Price
Transactions
2013
$150,229
$528,250
6
2012
$133,646
$461,000
5
2011
$144,500
$489,857
7
2010
$138,333
$415,000
1
2009
$140,036
$538,438
8
2008
-
$570,000
7
2007
$140,833
$549,429
7
2006
$151,767
$533,429
7
2005
$141,736
$528,600
10
2004
$102,667
$335,056
9
2003
$99,000
$351,000
7
|
the following is a slider of images. For screen reader users, all slides are visible at all time so you may ignore control buttons.
Sign-up and we'll email you new listings in this building!
Whether you’re a buyer, investor, or simply curious, this report is your key to unlocking in-depth insights and analysis on .
Please confirm your details: