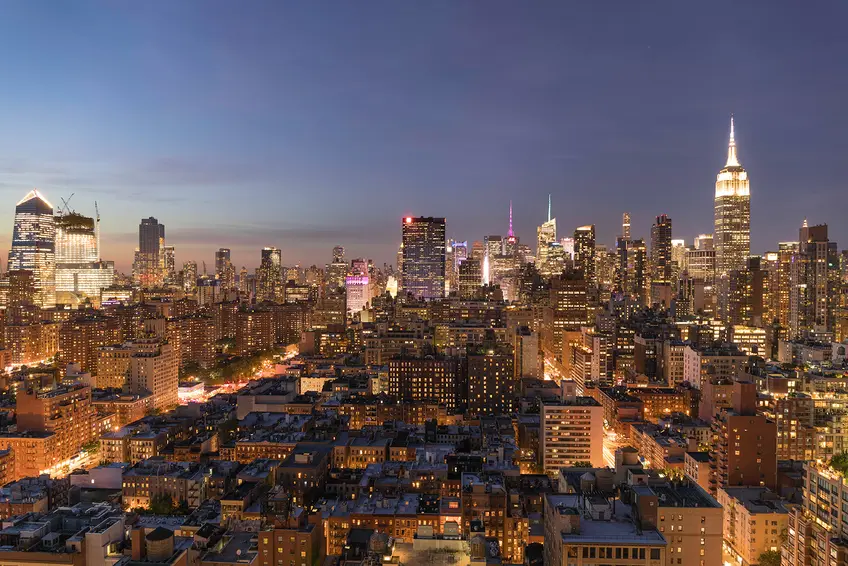
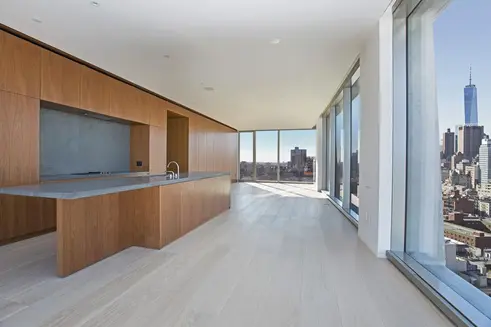
 View from Walker Tower, #PENTHOUSE1
The past ten years have been a roller coaster ride for just about all aspects of life, but that is especially clear for the New York real estate market. Ten years ago, the Lower Manhattan market was still striving to make a comeback in the wake of the tragedy of 9/11; today, CityRealty data shows that seven of the top ten neighborhoods that experienced the largest leaps in price and popularity are located downtown. There was also no such place as Billionaires' Row yet, which is the biggest driver behind the dramatic upswing in Midtown West prices. Moreover, Upper Manhattan was barely a blip on most brokers' and buyers' radars at the time, but Harlem has blossomed beautifully over the past ten years.
In this article:
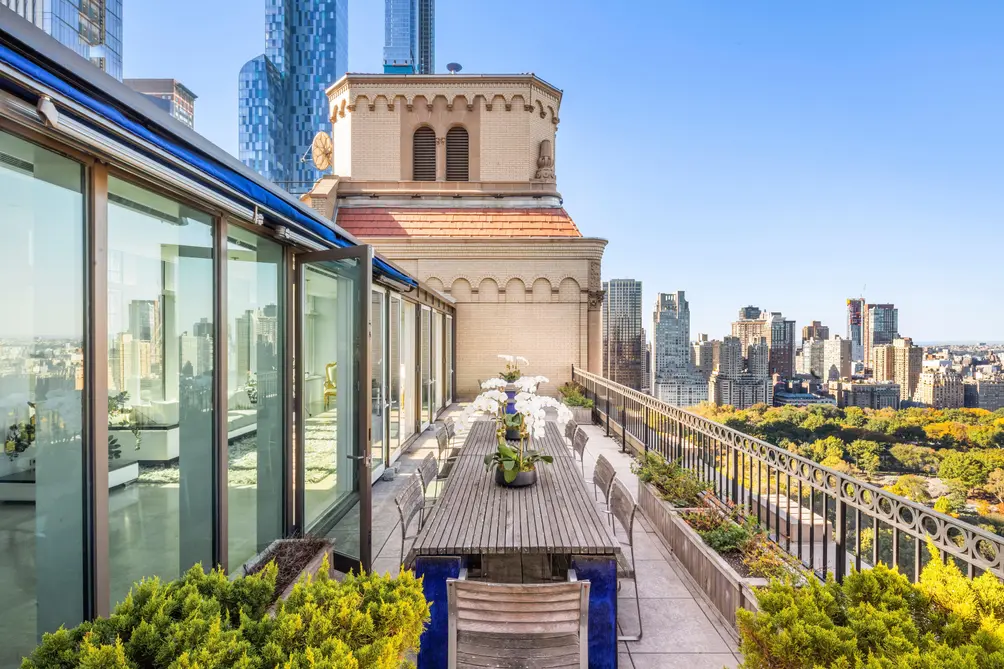 50 Central Park South at The Ritz-Carlton, #PH3435 is on the market for an affordable $49,000,000
Throughout New York, Manhattan condo closing prices have jumped from $1,178 per square foot to $1,822 per square foot, or up by 55 percent. Resurgent neighborhoods are but one factor at work here: Not only has a wave of "starchitects" descended on New York City, but each seems determined to outdo the other in terms of dizzying height, eye-catching design, and, in some lucky cases, lush outdoor space. An amenity war has also taken hold with New York's newest condos starting to offer exclusive restaurants, in-home vitamin IV drips, and a private IMAX theater...to name but a few!
CityRealty takes a look at the top ten best-performing neighborhoods over the past decade. We do not examine uptown neighborhoods due to the dearth of condos in them in 2009, but a recent building boom shows no sign of slowing down and is sure to change that.
In addition to exploring the top ten neighborhoods, we take a look at the top condo buildings in each area. This determination was reached based on the price per square foot of sales over the past 24 months, and the buildings in question were required to have three or more closings.
In addition to exploring the top ten neighborhoods, we take a look at the top condo buildings in each area. This determination was reached based on the price per square foot of sales over the past 24 months, and the buildings in question were required to have three or more closings.
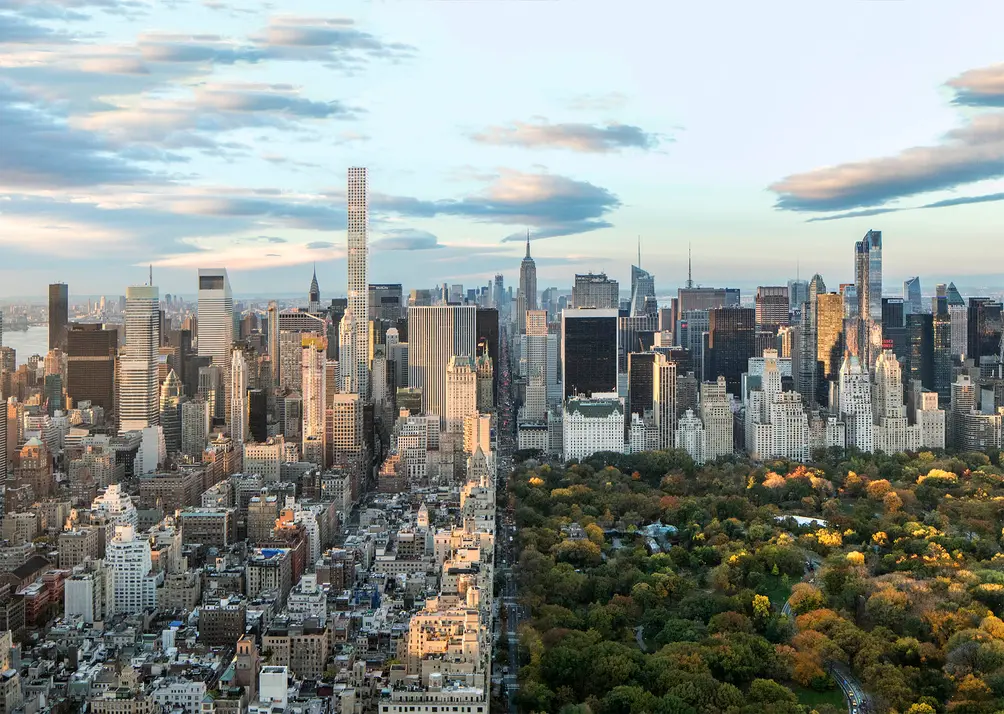 Skyline photo over Central Park featuring 432 Park Avenue | Rafael Vinoly Architects
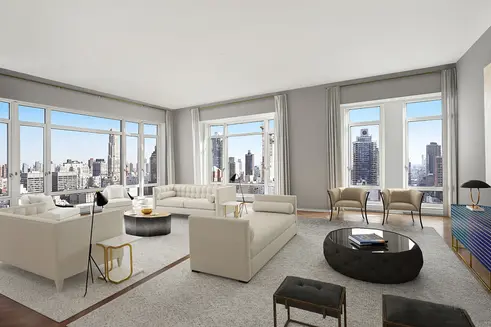
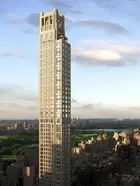
↓ 520 Park Avenue | Completed in 2018
26 sales averaging $5,597 per ft2 | 2 availabilities: $15.95M - $19.5M
 All images of 520 Park Avenue via Compass
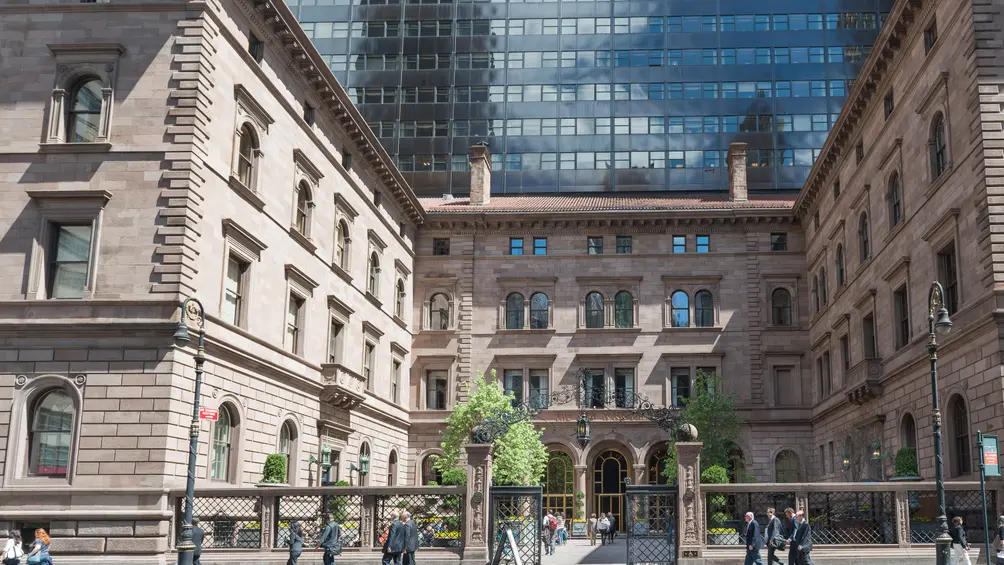 The Villard Houses off Madison Avenue
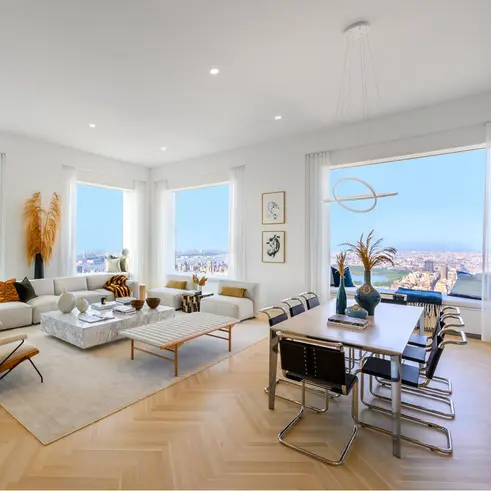
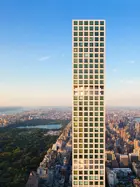
↓ 432 Park Avenue | Completed in 2015
32 sales averaging $5,668 per ft2 | 6 availabilities: $11M - $32.5M
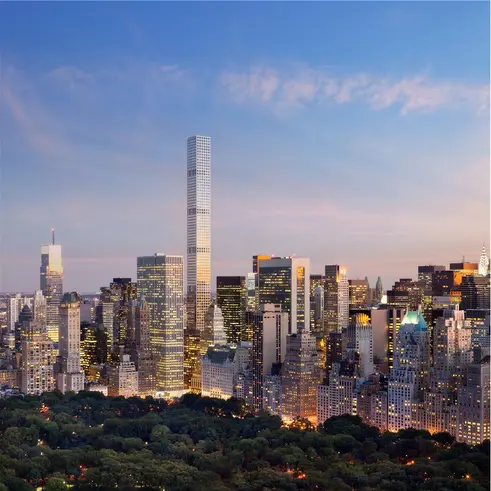 All images of 432 Park Avenue via Douglas Elliman
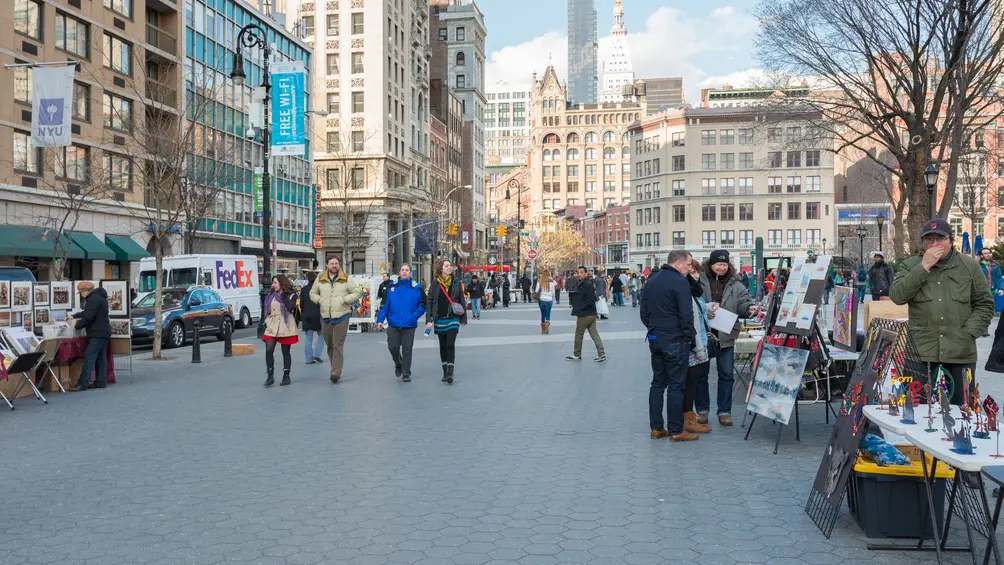 Union Square (CityRealty)
↓ 212 Fifth Avenue | Converted in 2016
Sales averaging $3,483 per ft2 | 1 availability for $4.95M
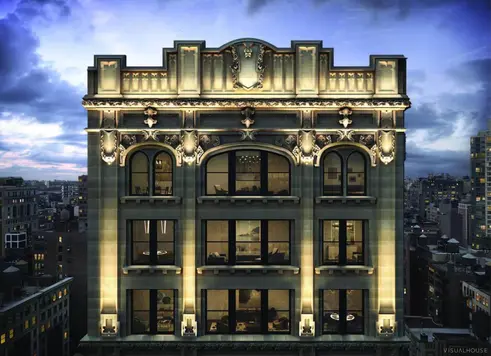 212 Fifth Avenue via Visualhouse
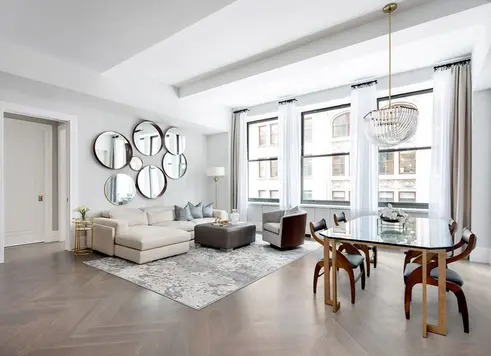 Interiors via Sotheby's
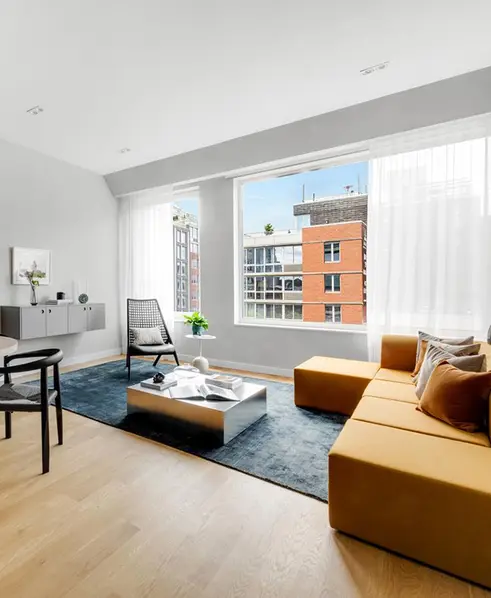
↓ 32 East 1st Street | Completed in 2019
19 sales averaging $2,527 per ft2 | 5 availabilities: $1.4M - $8.7M
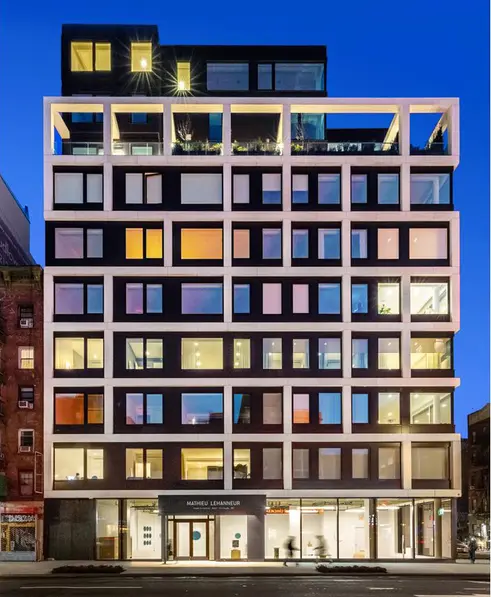 All images of 32 East 1st Street via Douglas Elliman
Would you like to tour any of these properties?
Just complete the info below.
Or call us at (212) 755-5544
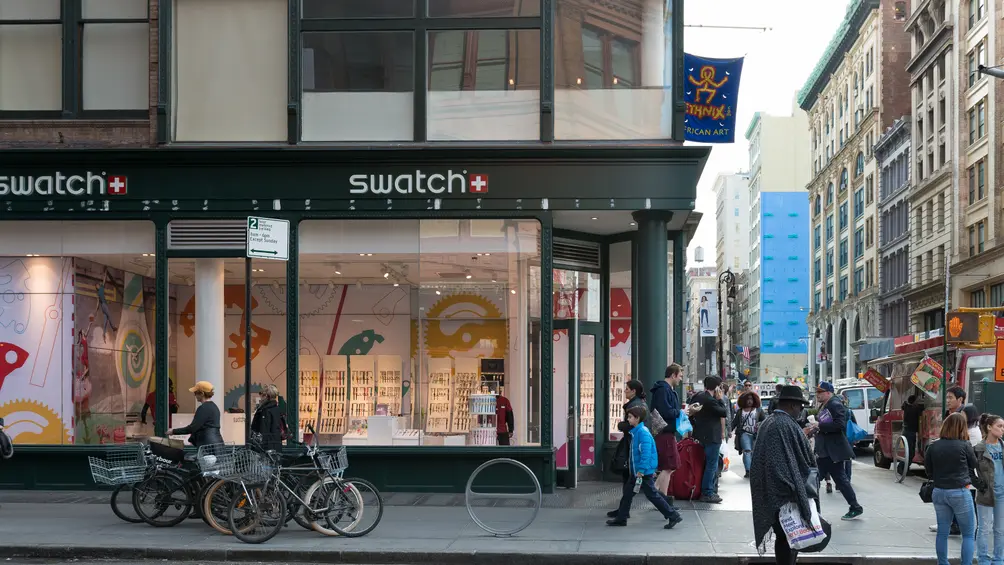 NoHo streetscape along Broadway
↓ 40 Bond, 40 Bond Street | Completed in 2007
4 sales averaging $2,847 per ft2 | 2 availabilities: $7M - $10.25M
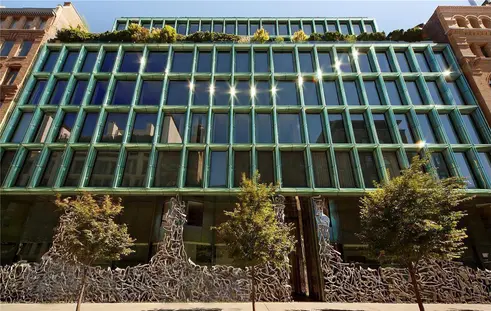 All images of 40 Bond via Douglas Elliman
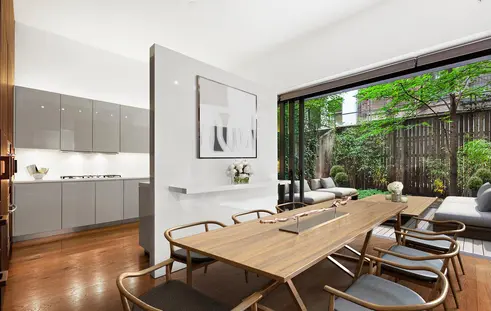
↓ 70 Vestry Street | Completed in 2018
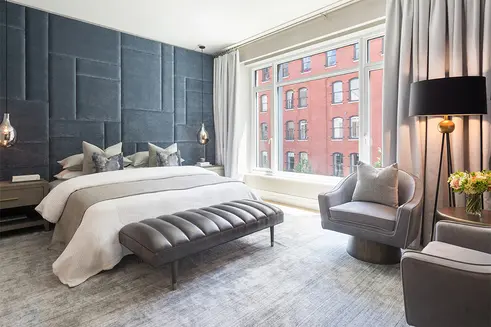
26 sales averaging $4,300 per ft2 | 6 availabilities: $8M - $28.5M
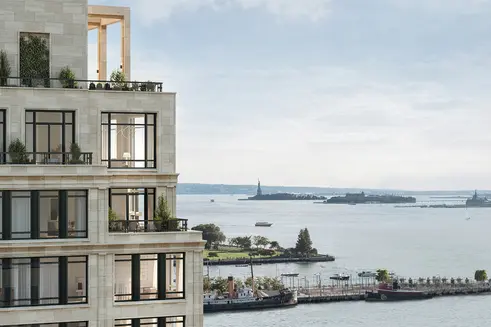 All images of 70 Vestry Street via The Corcoran Group
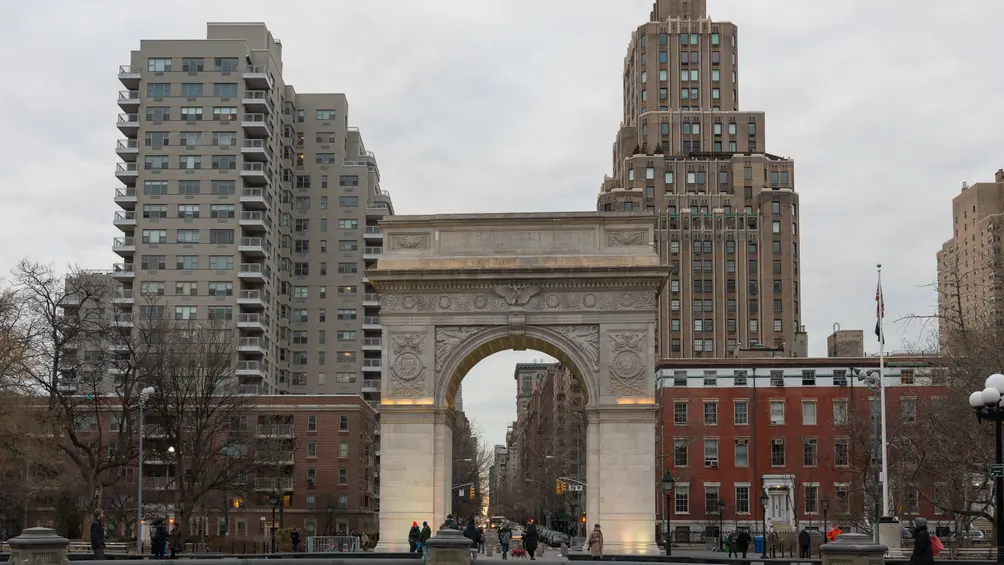 Washington Square Park in Greenwich Village
↓ The Greenwich Lane, 155 West 11th Street | Completed in 2015
7 sales averaging $3,347 per ft2 | 1 availability for $18M
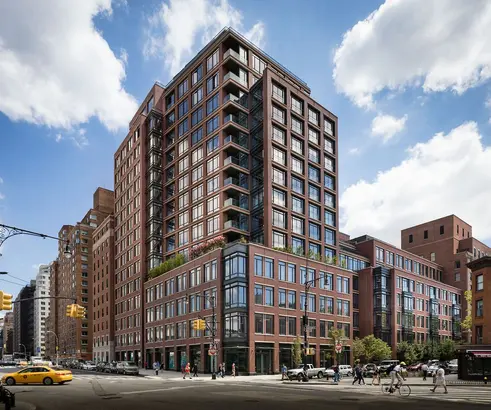 The Greenwich Lane via FXCollaborative
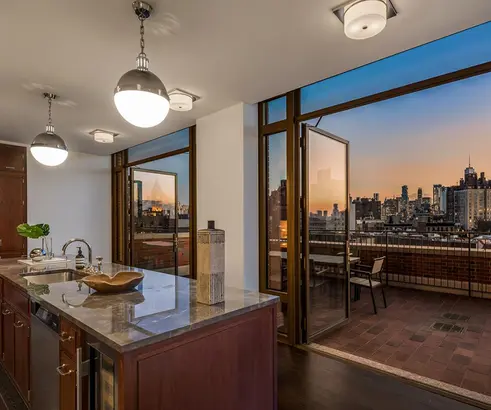 Interiors via Douglas Elliman
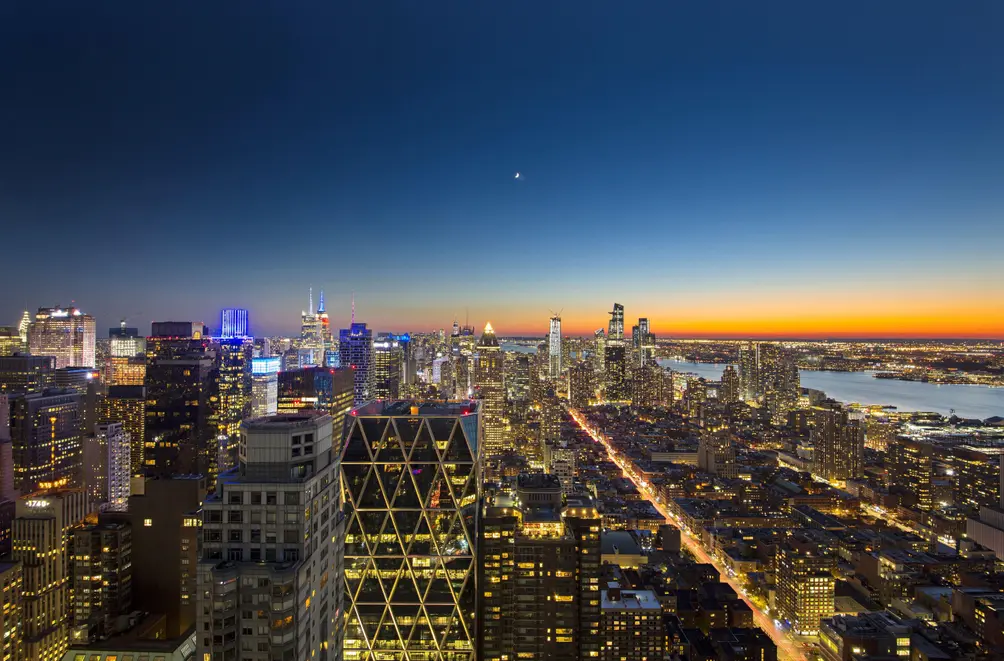 View of Midtown West from the available Time Warner Center, #PH80 (Corcoran)
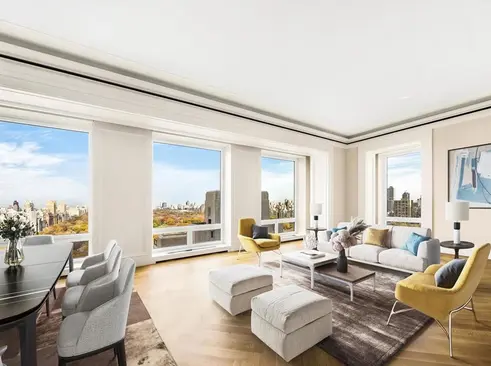
↓ 220 Central Park South | Completion estimated for 2020
63 sales averaging $7,064 per ft2 | 4 availabilities: $34,950 - $99,000/month
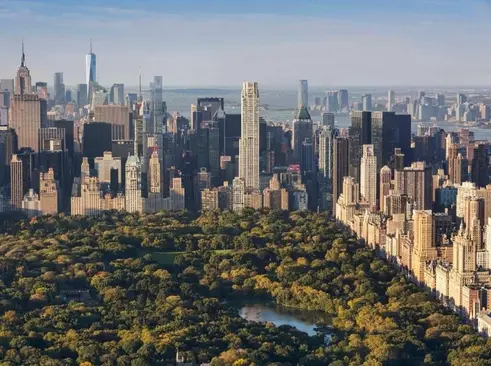 All images of 220 Central Park South via Compass
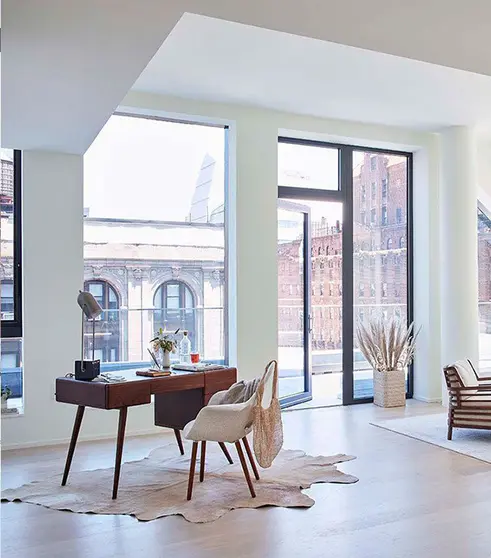
↓ 121 E 22nd, 121 East 22nd Street | Completed in 2019
71 sales averaging $2,098 per ft2 | 11 availabilities: $3M - $11M
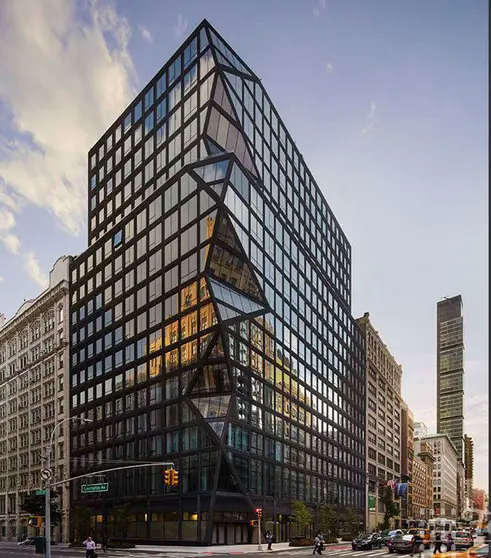 All images of 121 E 22nd via Toll Brothers City Living
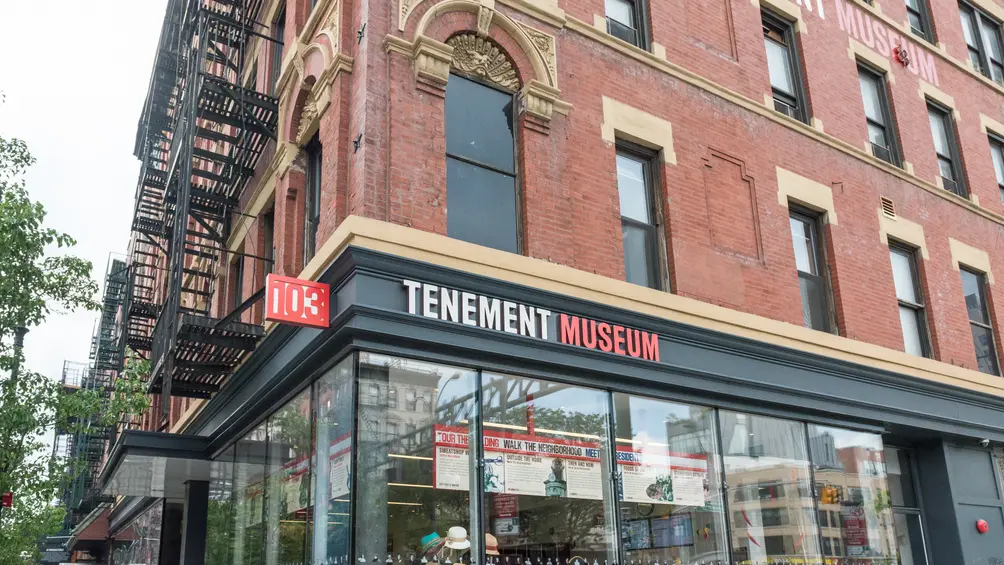 The Tenement Museum off Orchard Street
↓ 215 Chrystie Street | Completed in 2015
4 sales averaging $3,784 per ft2 | 1 availability for $7M
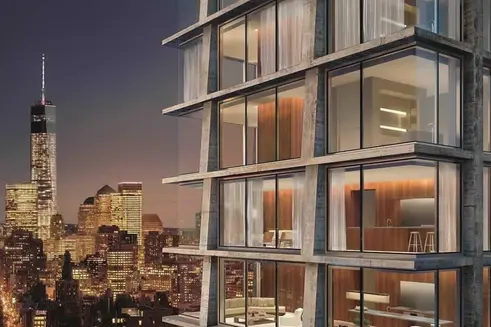 All images of 215 Chrystie Street via Olshan Realty
Would you like to tour any of these properties?
Just complete the info below.
Or call us at (212) 755-5544
Would you like to tour any of these properties?

 6sqft delivers the latest on real estate, architecture, and design, straight from New York City.
