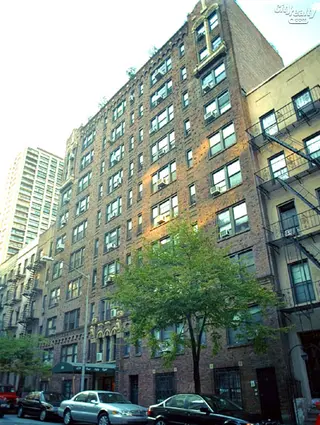
339 East 58th Street: Sales Summary
between Second Avenue & First Avenue Building Profile
All Sales
$0
Avg. Price / ft2
Past 12 months, based on 3 sales
$421,250
Avg. Price -
Past 12 months, based on 3 sales
$0
Median Price / ft2
Past 12 months, based on 3 sales
$392,500
Median Price
Past 12 months, based on 3 sales
Year
Avg Price / Ft2
Median Price / Ft2
Avg. Actual Price
Med. Actual Price
Transactions
2025
-
-
-
-
0
2024
-
$421,250
-
$392,500
3
2023
$675
$340,000
$675
$340,000
2
2022
$708
$345,571
$708
$320,000
7
2021
$692
$271,462
$700
$265,000
13
2020
-
$325,000
-
$325,000
1
2019
$1,054
$930,000
$1,054
$930,000
2
2018
-
$655,000
-
$655,000
1
2017
$817
$358,167
$817
$367,500
3
2016
$914
$405,000
$943
$340,000
4
2015
-
$339,250
-
$339,250
2
2014
$1,079
$850,000
$1,079
$560,000
5
2013
$727
$597,500
$727
$280,000
3
Year
Avg Price / Ft2
Median Price / Ft2
Avg. Actual Price
Med. Actual Price
Transactions
2012
$563
$372,887
$563
$422,500
3
2011
$622
$239,001
$622
$254,500
5
2010
$625
$425,993
$625
$257,980
3
2009
-
-
-
-
0
2008
$848
$404,800
$848
$339,000
5
2007
$811
$342,786
$811
$295,000
7
2006
$608
$253,333
$600
$250,000
3
2005
$702
$294,628
$723
$269,000
15
2004
$504
$240,748
$450
$194,000
11
2003
$398
$165,000
$398
$170,000
3
The Breakdown of All Sales by Apartment Size

 6sqft delivers the latest on real estate, architecture, and design, straight from New York City.
