Harridge House, 225 East 57th Street - Midtown East
- Apartments
- Overview & Photos
- Maps
- Floorplans
- Sales Data & Comps
- Similar Buildings
- All Units
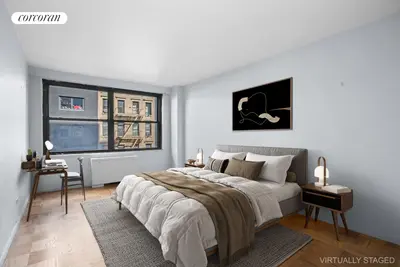


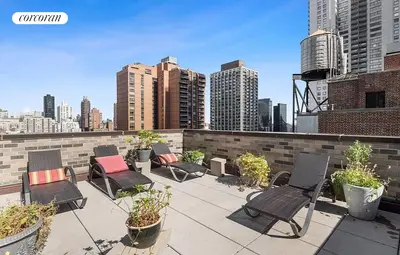
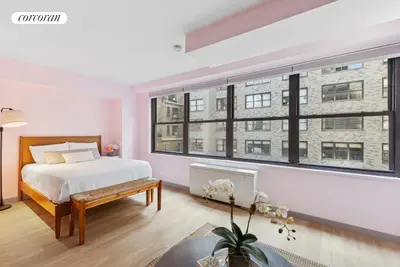

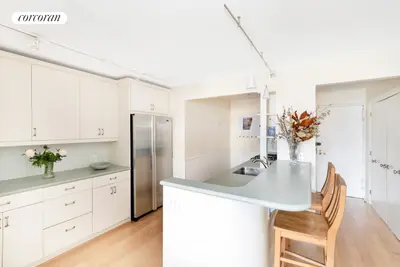
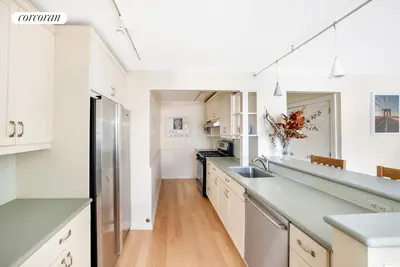
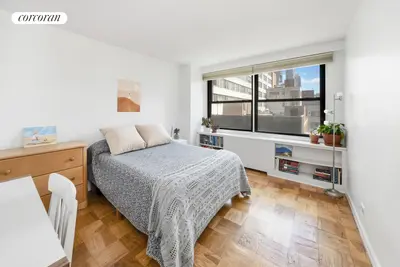

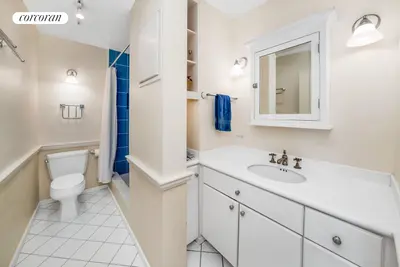
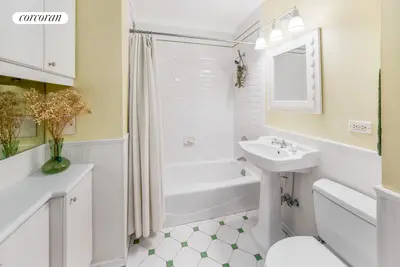
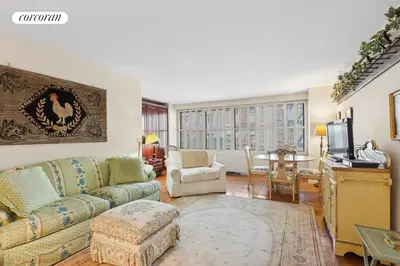
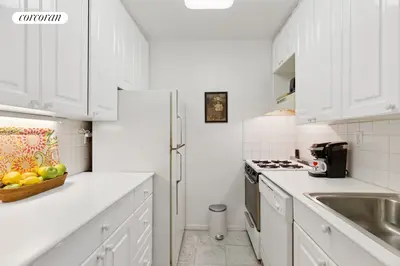
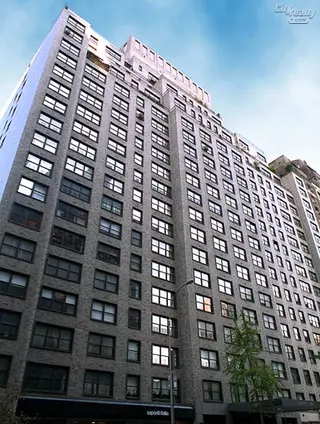
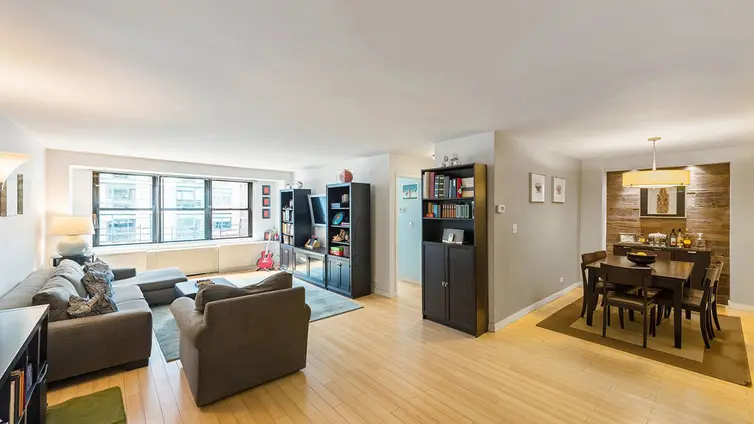
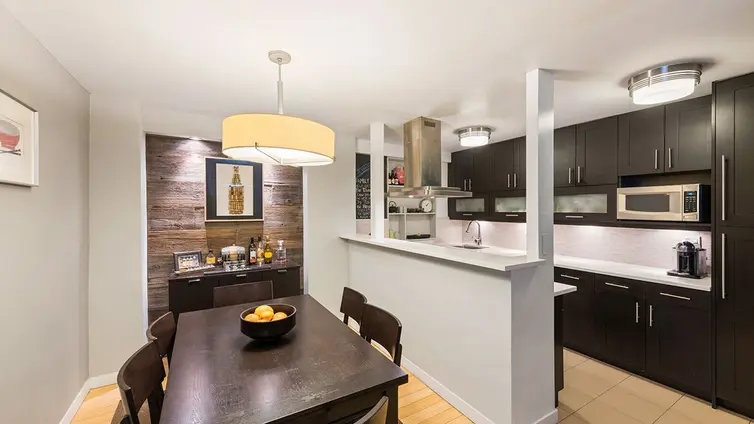
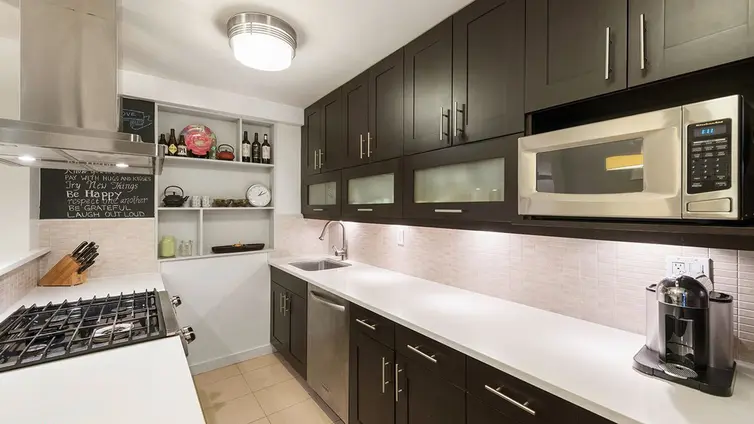
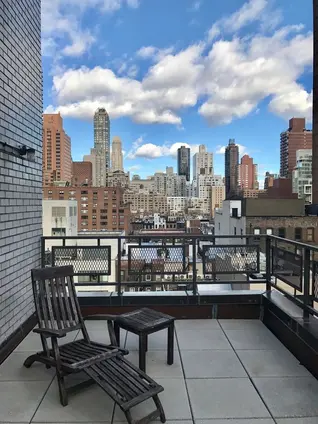
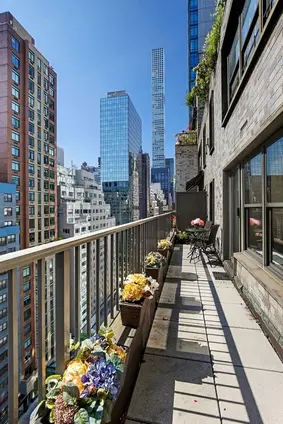
Harridge House is a full-service post-war cooperative located at 225 East 57th Street. The building has an attentive staff, marble and glass lobby, renovated hallways, renovated laundry room, a computerized package tracking system, a bike room, an on-site garage with direct building access, and a roof deck.
Harridge House is well situated near Fifth Avenue shopping, home decor shops along Third Avenue, Wolfgang's Steakhouse, P.J. Clarke's, Serendipity 3, Whole Foods, Lexington Avenue subway stops, and the Roosevelt Avenue Tramway Plaza. Pied-a-terre ownership is allowed, and the building does not allow dogs other than service/support animals.

View school info, local attractions, transportation options & more.
Experience amazing 3D aerial maps and fly throughs.
For some co-ops, instead of price per square foot, we use an estimate of the number of rooms for each sold apartment to chart price changes over time. This is because many co-op listings do not include square footage information, and this makes it challenging to calculate accurate square-foot averages.
By displaying the price per estimated room count, we are able to provide a more reliable and consistent metric for comparing sales in the building. While we hope that this gives you a clearer sense of price trends in the building, all data should be independently verified. All data provided are only estimates and should not be used to make any purchase or sale decision.