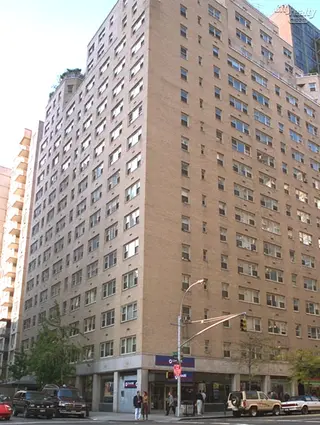
The Sutton East, 345 East 56th Street: Sales Summary
between Second Avenue & First Avenue Building Profile
All Sales
$526
Avg. Price / ft2
Past 12 months, based on 8 sales
$668,920
Avg. Price -
Past 12 months, based on 8 sales
$526
Median Price / ft2
Past 12 months, based on 8 sales
$625,000
Median Price
Past 12 months, based on 8 sales
Year
Avg Price / Ft2
Median Price / Ft2
Avg. Actual Price
Med. Actual Price
Transactions
2025
-
$625,000
-
$625,000
2
2024
$526
$683,560
$526
$641,680
6
2023
$795
$827,111
$773
$800,000
9
2022
$932
$638,675
$793
$703,750
8
2021
$851
$1,047,189
$886
$1,037,825
14
2020
-
$696,969
-
$707,000
8
2019
-
$907,500
-
$907,500
2
2018
$830
$1,017,133
$830
$1,080,000
6
2017
$874
$1,143,250
$879
$1,202,500
10
2016
$1,000
$772,000
$1,000
$515,000
5
2015
$949
$902,111
$949
$899,000
9
2014
$796
$987,183
$692
$708,500
10
2013
$762
$807,222
$762
$592,500
9
Year
Avg Price / Ft2
Median Price / Ft2
Avg. Actual Price
Med. Actual Price
Transactions
2012
$619
$391,300
$619
$310,000
7
2011
$588
$811,063
$588
$815,000
8
2010
$579
$813,917
$579
$627,500
6
2009
$583
$640,833
$583
$600,000
3
2008
$673
$661,300
$673
$385,000
5
2007
$736
$763,286
$773
$752,500
14
2006
$741
$812,944
$708
$707,500
9
2005
$612
$602,917
$612
$626,250
6
2004
$500
$626,467
$500
$550,000
15
2003
$440
$509,150
$430
$474,500
10
The Breakdown of All Sales by Apartment Size