323 West 43rd Street - Midtown West
- Apartments
- Overview & Photos
- Maps
- Floorplans
- Sales Data & Comps
- Similar Buildings
- All Units
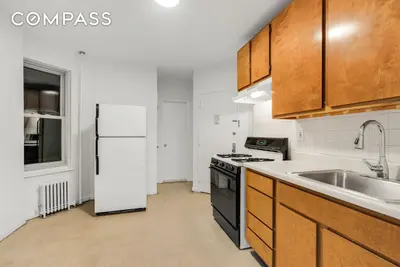

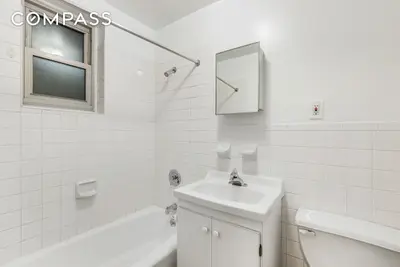
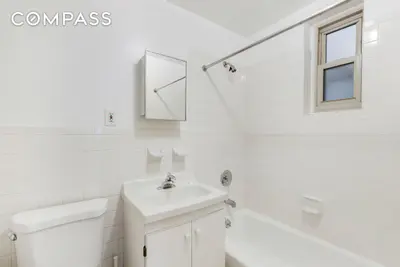
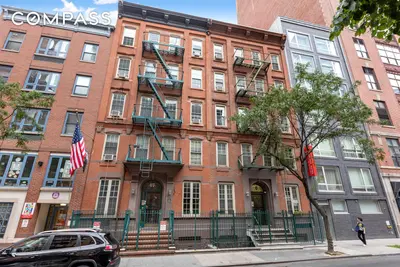
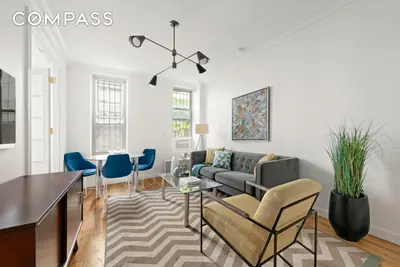
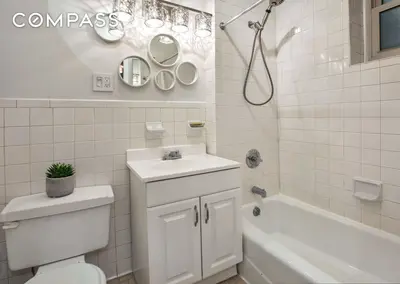
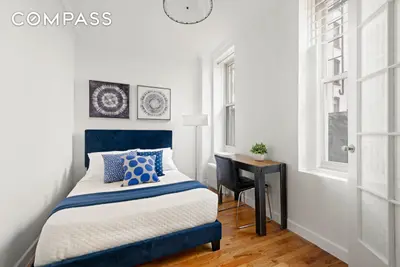
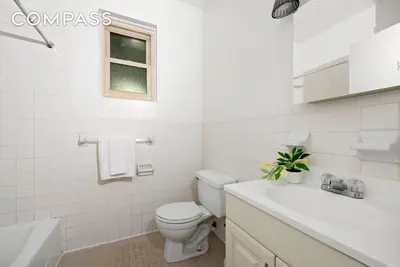
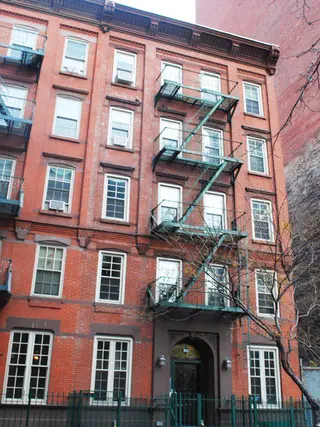
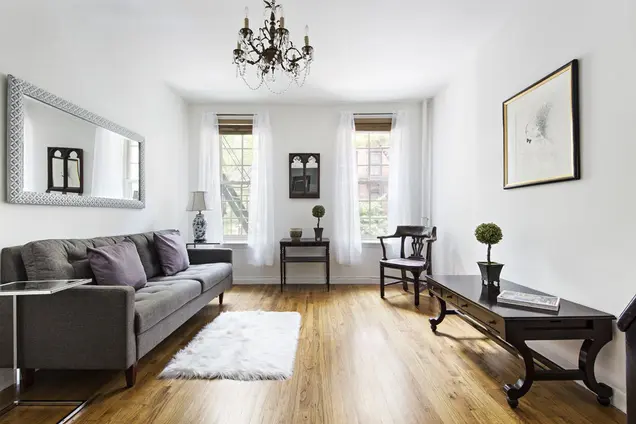
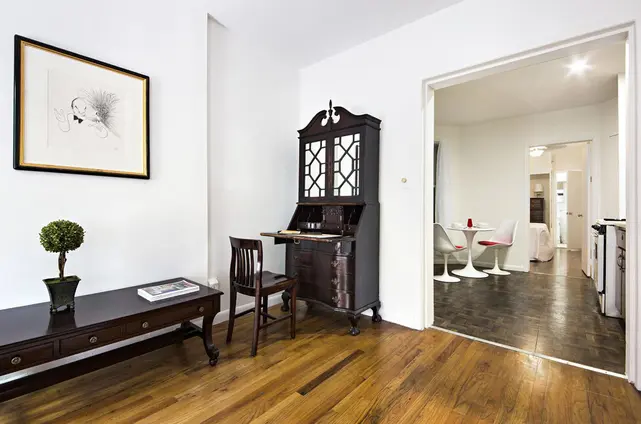
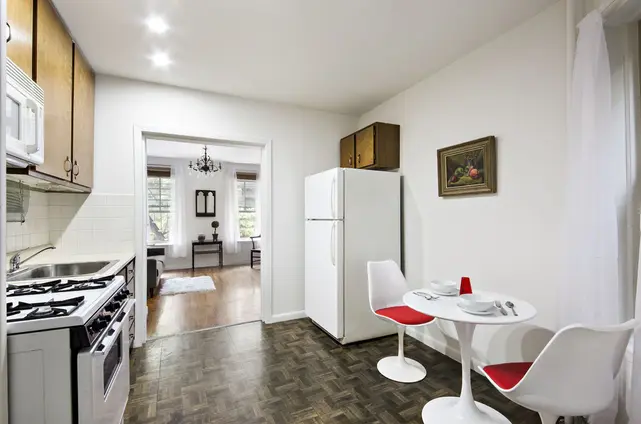
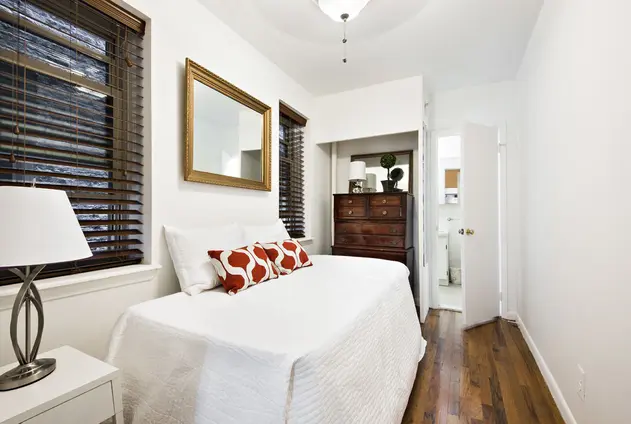
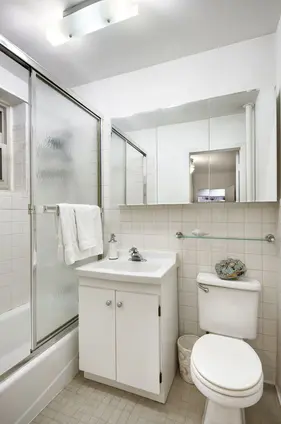
This impeccably maintained HDFC co-op building at 323 West 43rd Street has a handsome brick townhouse-like façade. The building features a live-in super, free laundry in the basement, and a common patio. Cats are permitted.
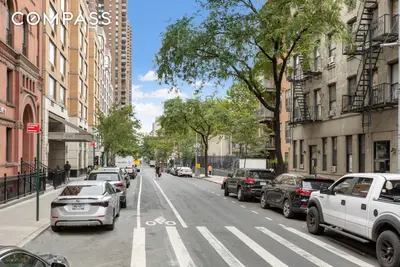
The growing Hudson Yards and Manhattan West developments are to the south, while the Shops at Columbus Circle to the north provide premier shopping, dining, and entertainment. The High Line, Hudson River Greenway, and nearby Central Park provide glorious outdoor space. The eclectic restaurant scene of 9th Avenue is just around the corner, and legendary Restaurant Row is a block away. Transportation is unbeatable with Port Authority and Times Square providing immediate access to A/C/E, 1/2/3, N/Q/R, S, and 7 trains.

View school info, local attractions, transportation options & more.
Experience amazing 3D aerial maps and fly throughs.
For some co-ops, instead of price per square foot, we use an estimate of the number of rooms for each sold apartment to chart price changes over time. This is because many co-op listings do not include square footage information, and this makes it challenging to calculate accurate square-foot averages.
By displaying the price per estimated room count, we are able to provide a more reliable and consistent metric for comparing sales in the building. While we hope that this gives you a clearer sense of price trends in the building, all data should be independently verified. All data provided are only estimates and should not be used to make any purchase or sale decision.


