Skip to Content
788 Ninth Avenue - Midtown West
788 Ninth Avenue
Co-Op in Midtown West
  • Apartments
  • Overview & Photos
  • Maps
  • Floorplans
  • Sales Data & Comps
  • Similar Buildings
Get alerts with new listings in this building!
788 Ninth Avenue

788 Ninth Avenue

Co-op located in Midtown West, between West 52nd Street & West 53rd Street  Map

  • Recent Sales (7)
  • All Units in Building (13)
Unit #
Beds
Baths
Size
Closing Price
Price / Ft2
Asking Price
Sold on
View Full Sales History

Overview of 788 Ninth Avenue

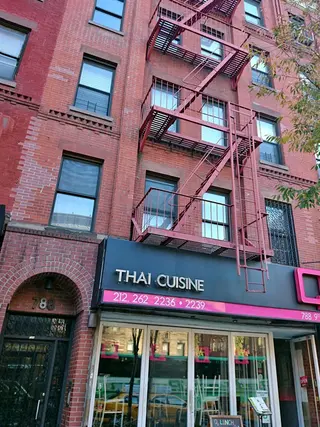
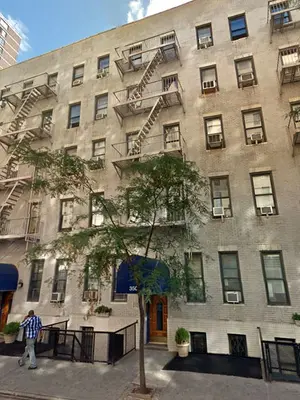
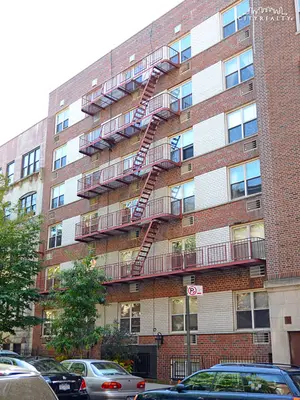
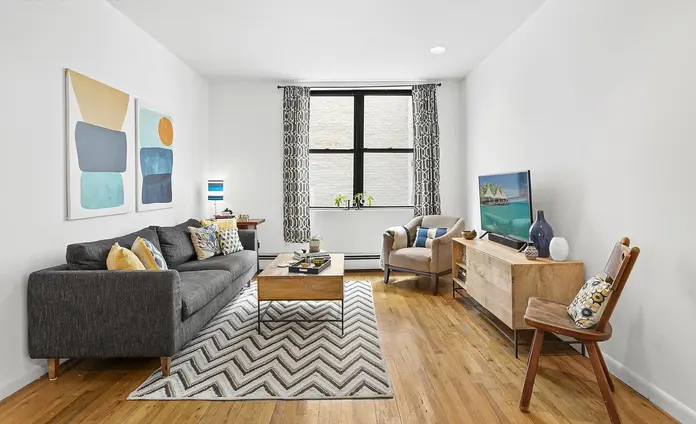
788 Ninth Avenue is a boutique walk-up cooperative with 11 residential units and one commercial unit. The building has a central laundry and new video intercom. Co-purchasing, gifting, guarantors, and in-unit washer/dryers are permitted, as are cats (but not dogs). It is located between West 52nd and 53rd Streets near the Theater District, Hell's Kitchen dining and nightlife, Lincoln Center, Columbus Circle, and myriad subway lines.

Year Built
1920
Apartments
13
Floors
5
Neighborhood
Min Down
20%
13Apartments
View All Past
Sales & Rentals
in Building

Schedule a Visit

Select when you would like to view apartments.
Sat
08
Sun
09
Mon
10
Tue
11
Wed
12
Thu
13
Fri
14
Sat
15
Sun
16
Mon
17

What Time?

9am-noon
Noon-3pm
3pm-6pm
Any time
You can also call us anytime at
☎️ (212) 755-5544

Shh... Many units sell without being publicly listed.

Interested in off-market listings at 788 Ninth Avenue? Some previously listed residences might be available – contact us for insider details on potential opportunities!

{ "key" : "AIzaSyDquABdSLhathmwfnoTcYwA1BY6coZZyZk", "lat": 40.76483, "lng": -73.98756, "marker": { "icon": "https://img3.cityrealty.com/neo/i/w/amenities/base.png" } }

Nearby Subways

  1. C
  2. E
at 8th Ave and 51st 0.18 miles
  1. 1
at Broadway 0.29 miles
  1. B
  2. D
at Broadway and 53rd 0.34 miles
  1. N
  2. Q
  3. R
at 7th Ave 0.36 miles
  1. A
at Columbus Circle 0.38 miles

Nearby Schools

  1. Ps 35
    Grades: KG,2,3,4,5,6,7,8,9,10,11,12,UG
  2. CITY KNOLL MIDDLE SCHOOL
    Grades: 6,7,8,UG
  3. Ps 111 Adolph S Ochs
    Grades: PK,KG,1,2,3,4,5
  4. Business Of Sports School
    Grades: 9,10,11,12
  5. Urban Assembly Gateway School For Technology
    Grades: 9,10,11,12
Data courtesy of GreatSchools.org
  1. Sacred Heart Of Jesus School
    Grades: PK,KG,1,2,3,4,5,6,7,8
  2. Bilingual Buds Inc DBA Hudsonway Immersion School
    Grades: PK,TK,KG,1,2,3,4,5,6
  3. The Speyer Legacy School
    Grades: KG,1,2,3,4,5,6,7,8
  4. The Family School West
    Grades: PK,KG
  5. Polly Dodge Early Learning Center
    Grades: PK,KG
Data courtesy of GreatSchools.org
Loading...

788 Ninth Avenue Floorplans

Apt 4B
1 bed, 1 bath, Approx. 550 ft2
Last sold for $460,000
on Oct 15, 2024
View Unit History
Apt 5B
2 beds, 1 bath, Approx. 751 ft2
Last sold for $775,000
on Apr 5, 2022
View Unit History
Apt 5A
2 beds, 1 bath, Approx. 846 ft2
Last sold for $700,000
on Jul 13, 2016
View Unit History
Apt GARDEN
1 bed, 2 baths, Approx. ft2
Last listed for $775,000
Taken off market Sep 12, 2023
View Unit History
Apt 4C
1 bed, 1 bath, Approx. 600 ft2
Last listed for $495,000
Taken off market Jun 15, 2021
View Unit History
Apt 3A/4A
2 beds, 3 baths, Approx. 1,600 ft2
Last listed for $1,599,000
Taken off market Sep 1, 2017
View Unit History
View All Floorplans

Sales History

Price/Room (Est)

Why are we displaying the estimated price per room?

For some co-ops, instead of price per square foot, we use an estimate of the number of rooms for each sold apartment to chart price changes over time. This is because many co-op listings do not include square footage information, and this makes it challenging to calculate accurate square-foot averages.

By displaying the price per estimated room count, we are able to provide a more reliable and consistent metric for comparing sales in the building. While we hope that this gives you a clearer sense of price trends in the building, all data should be independently verified. All data provided are only estimates and should not be used to make any purchase or sale decision.

Price/Ft2 (Est)
View Full Closing History
Created with Highstock 5.0.0SalesPrice Per Sq. Ft.20032004200520062007200820092010201120122013201420152016201720182019202020212022202320242025012345$400$600$800$1,000$1,200$1,400Please note that price/ft2 calculations is from only 52% of total transactions during the period
Year
Avg Price / Ft2 (Est) Median Price / Ft2 (Est) Avg. Actual Price Med. Actual Price
Transactions
2025
-
$480,000
-
$480,000
1
2024
$836
$460,000
$836
$460,000
2
2023
-
$752,500
-
$752,500
1
2022
$1,032
$775,000
$1,032
$775,000
1
2021
-
$472,750
-
$472,750
2
2020
-
-
-
-
0
2019
-
$237,500
-
$237,500
1
2018
-
-
-
-
0
2017
$981
$798,125
$981
$618,750
4
2016
$868
$600,000
$868
$600,000
2
2015
$782
$422,500
$782
$422,500
2
2014
-
-
-
-
0
Year
Avg Price / Ft2 (Est) Median Price / Ft2 (Est) Avg. Actual Price Med. Actual Price
Transactions
2013
-
-
-
-
0
2012
$872
$655,000
$872
$655,000
1
2011
$597
$955,000
$597
$955,000
1
2010
$732
$550,000
$732
$550,000
1
2009
-
-
-
-
0
2008
-
$154,000
$154,000
1
2007
$727
$400,000
$727
$400,000
1
2006
$760
$418,000
$760
$418,000
1
2005
-
-
-
-
0
2004
-
$275,000
$275,000
1
2003
-
-
-
-
0
Please note that price/ft2 calculations is from only 52% of total transactions during the period
Year
Avg Price / Room (Est) Avg. Actual Price Med. Actual Price
Transactions
2025
$160,000
$480,000
1
2024
$153,333
$460,000
2
2023
$150,500
$752,500
1
2022
$193,750
$775,000
1
2021
$157,583
$472,750
2
2020
-
-
0
2019
$79,167
$237,500
1
2018
-
-
0
2017
$173,925
$798,125
4
2016
$170,833
$600,000
2
2015
$140,833
$422,500
2
2014
-
-
0
Year
Avg Price / Room (Est) Avg. Actual Price Med. Actual Price
Transactions
2013
-
-
0
2012
$163,750
$655,000
1
2011
$136,429
$955,000
1
2010
$137,500
$550,000
1
2009
-
-
0
2008
$51,333
$154,000
1
2007
$133,333
$400,000
1
2006
$139,333
$418,000
1
2005
-
-
0
2004
$91,667
$275,000
1
2003
-
-
0

Sales History by Apartment Size

View Full Closing History
Show:
Created with Highstock 5.0.0Price/Ft²200520062007200820092010201120122013201420152016201720182019202020212022202320242025$500$600$700$800$900$1,000

Pricing Comparison of Similar Buildings

View Detailed Comparison
Average Price per Sq. Ft.
$262,500
-
$236,250
-
$210,000
-
$183,750
-
$157,500
-
$131,250
-
$105,000
-
$78,750
-
$52,500
-
$26,250
-
$0
-
62 West 87th Street
225 West 25th Street
110 West 94th Street
Little Gramercy
Chelsea Court
100 West 15th Street
The Prospect Hall
225 East 47th Street
350 West 56th Street
Townsend Mews
314 West 56th Street
240 East 30th Street
715 Ninth Avenue
788 Ninth Avenue
304 East 73rd Street
328 East 73rd Street
218 East 82nd Street
The Sandgate
288 West 92nd Street
315 East 77th Street
 
|||


Similar Buildings

The Greenwich by Rafael Vinoly
at the northwest corner of Thames Street
Financial District
Sun-drenched homes at the economic center of the world | Imminent occupancy
Learn More

the following is a slider of images. For screen reader users, all slides are visible at all time so you may ignore control buttons.


Before you move on from this page

Sign-up and we'll email you new listings in this building!

or
Save Building with Email
By continuing you accept the Terms & Privacy Policy