Berkeley House, 120 Central Park South - Midtown West
- Apartments
- Overview & Photos
- Maps
- Floorplans
- Sales Data & Comps
- Similar Buildings
- All Units


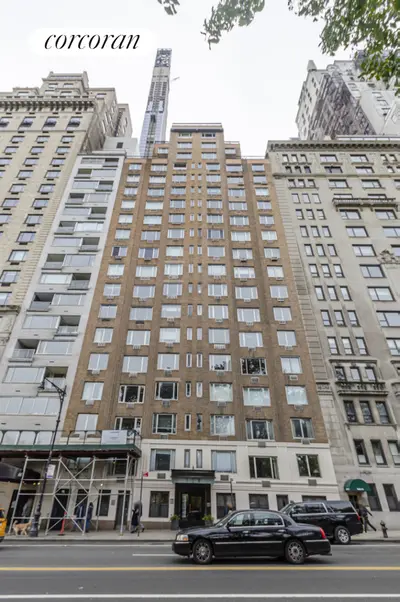
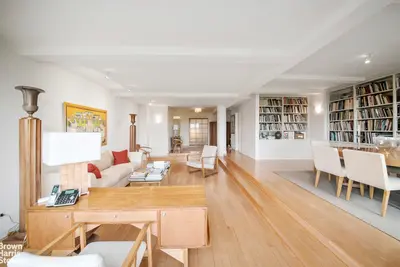
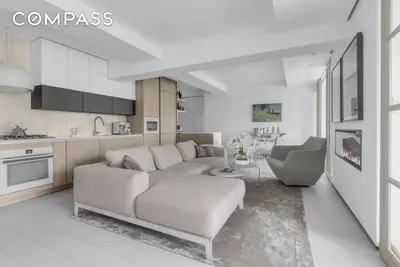
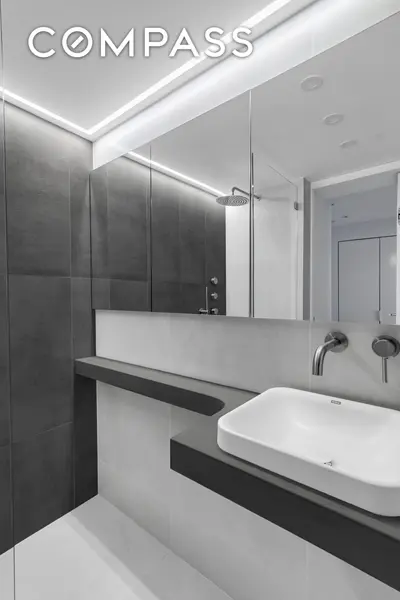
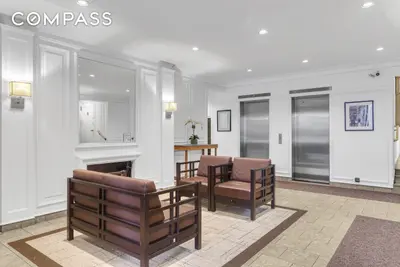

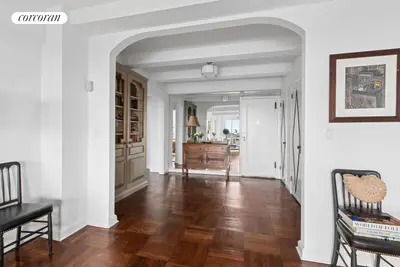


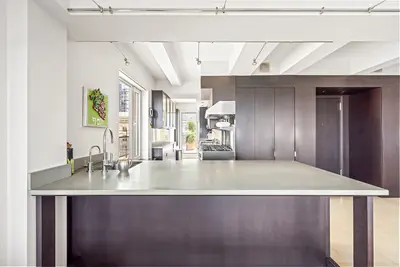
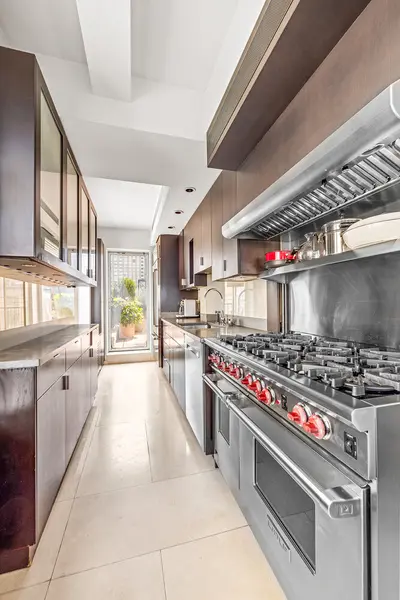
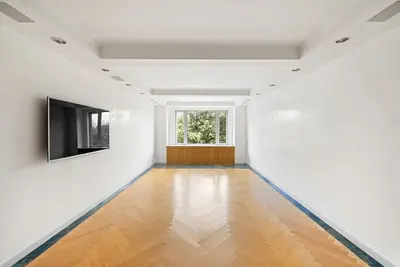

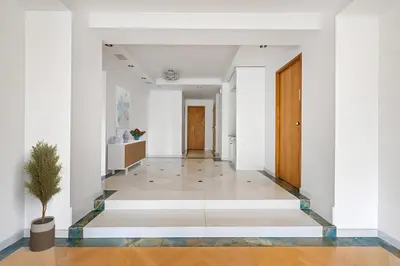

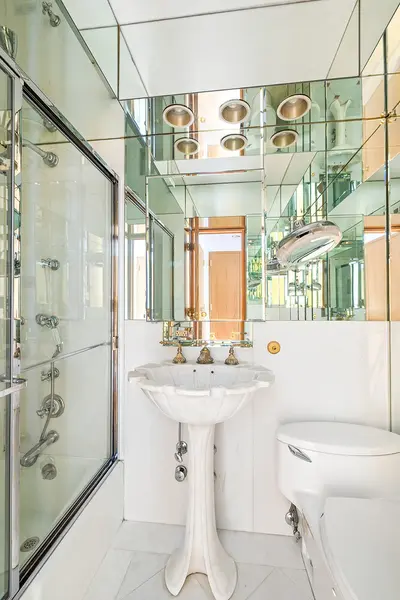
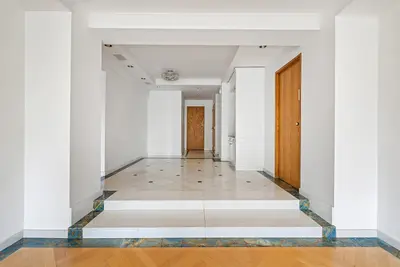
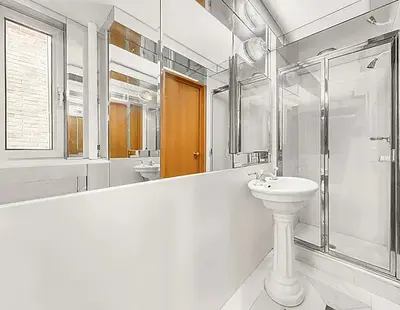
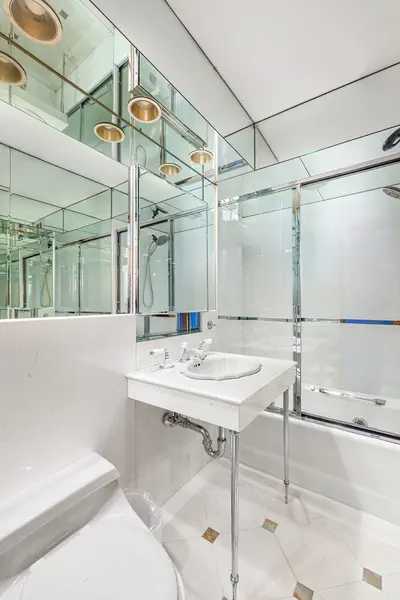
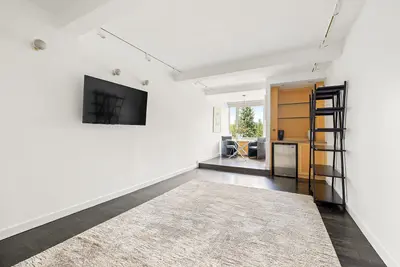

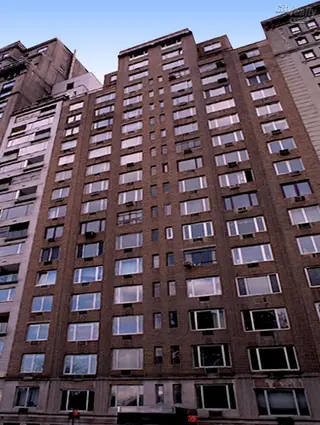
Berkeley House, designed by Hyman Isaac Feldman in 1942, is a distinguished 20-story cooperative at 120 Central Park South. The building features a handsome entrance marquee, two-story limestone base, and houses 100 apartments. It was converted to cooperative in 1980 and maintains a full-service, white-glove standard with 24-hour doorman service and attended elevator.
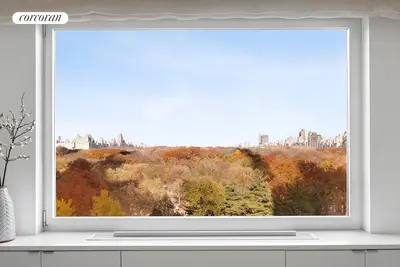
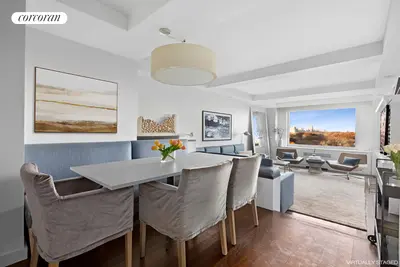
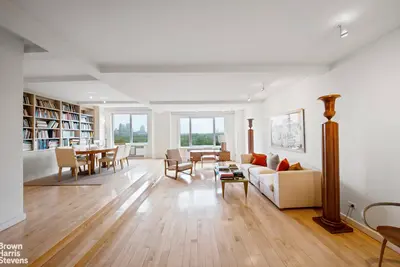
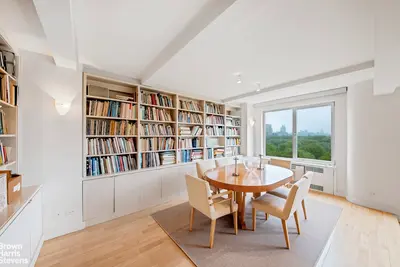
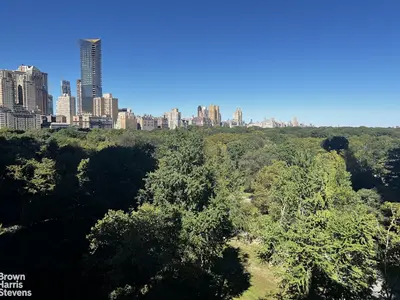
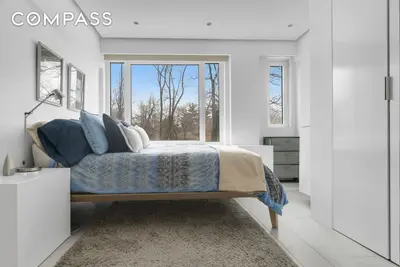
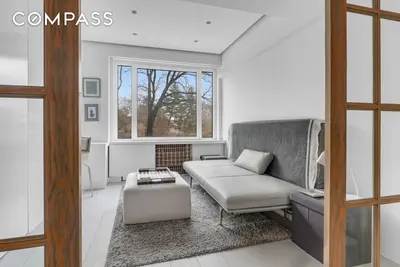
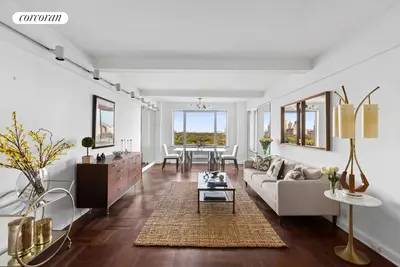
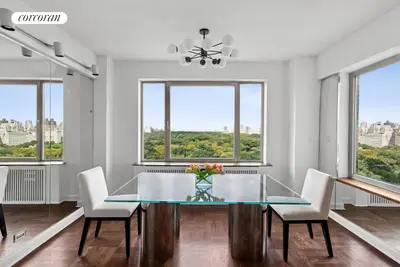
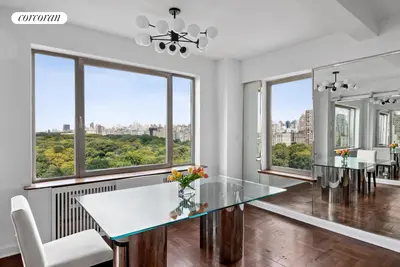
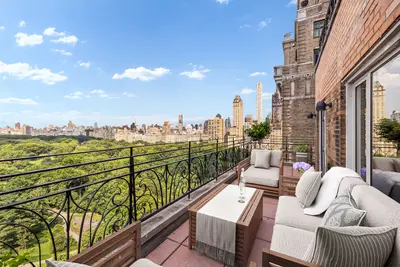
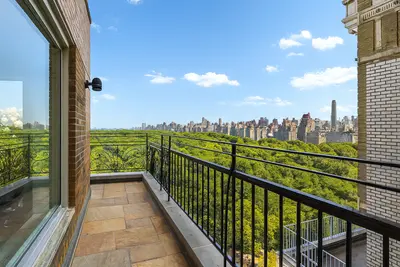
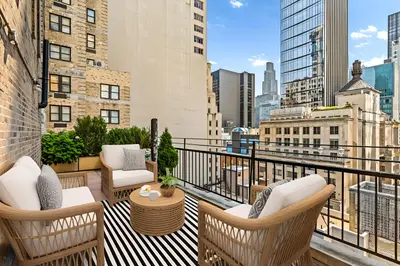
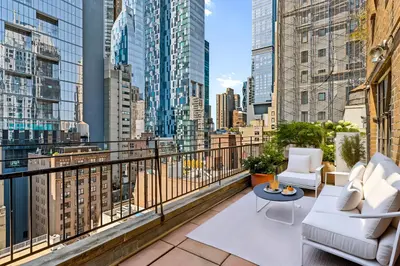
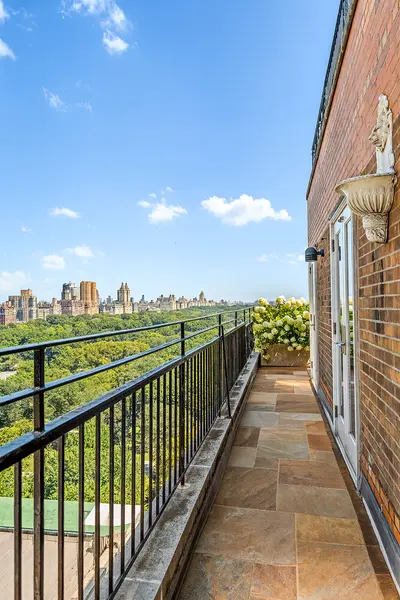
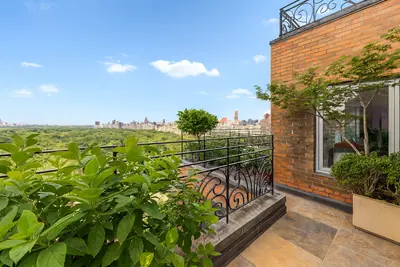
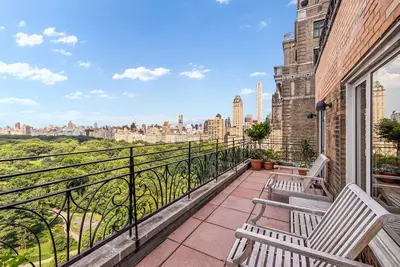
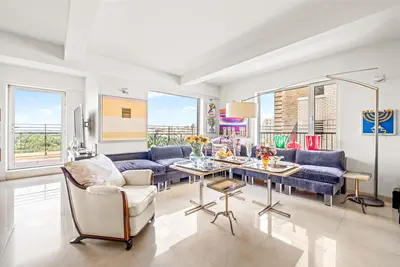
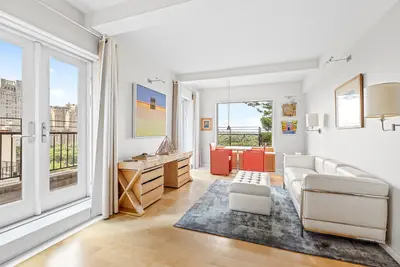
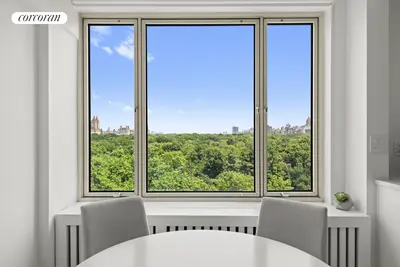
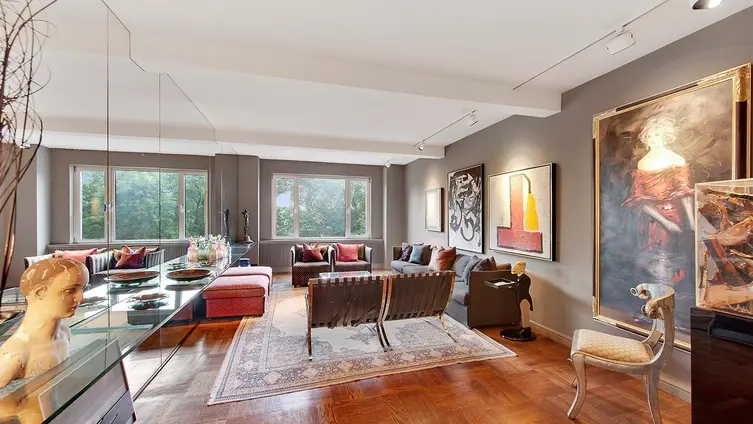
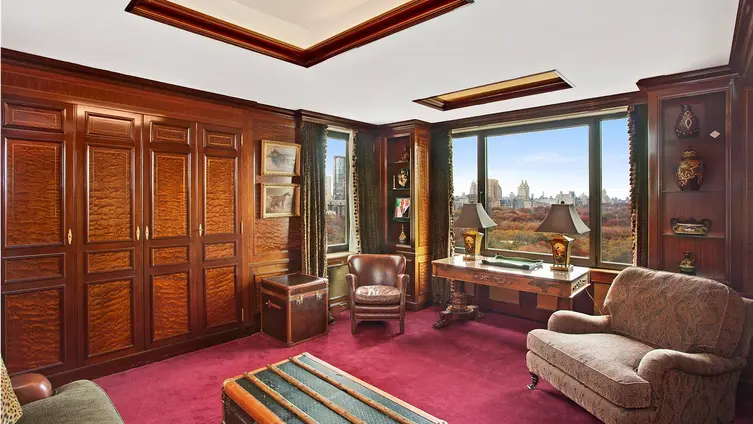
The building occupies a prime mid-block position between Sixth and Seventh Avenues, sharing the block with notable neighbors including Trump Parc, Essex House, and Hampshire House. Its location offers spectacular, unobstructed views of Central Park, along with vistas of the Upper Fifth Avenue and Central Park West skylines. The area has evolved into a highly desirable residential location, with convenient access to Fifth Avenue shopping, Carnegie Hall, Lincoln Center, and the Time Warner Center with its Whole Foods market.
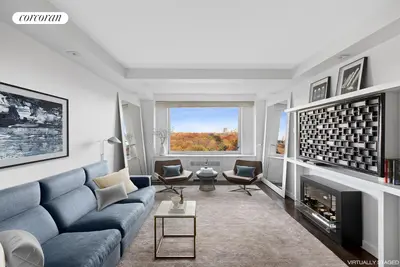
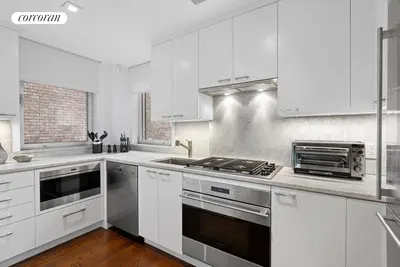
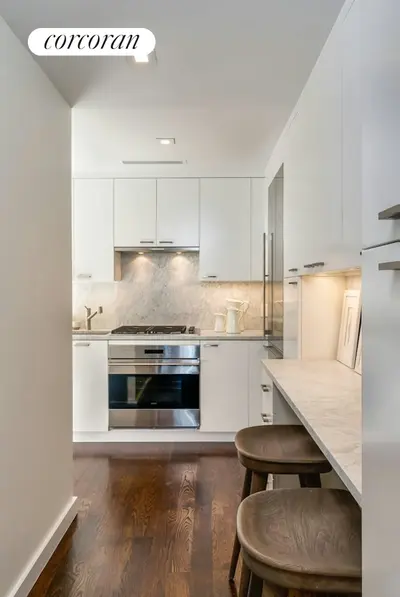
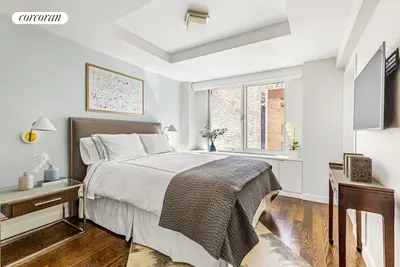
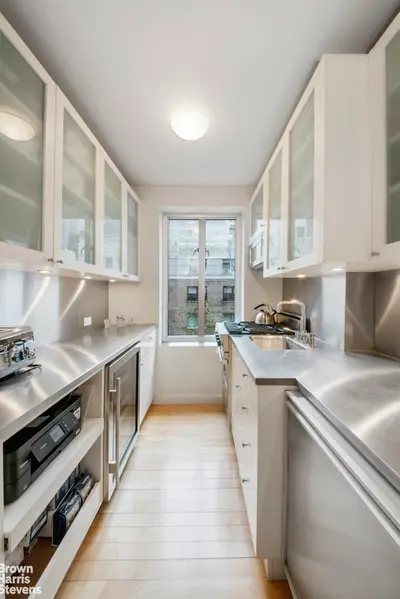
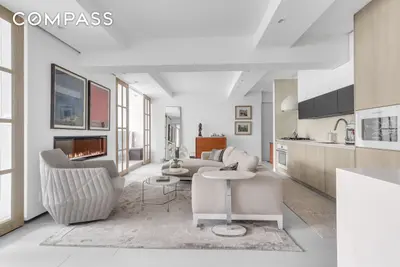
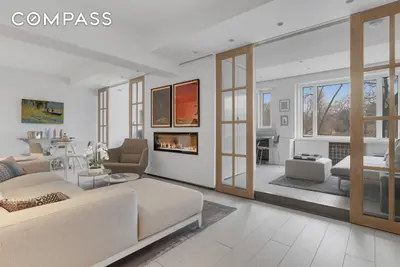
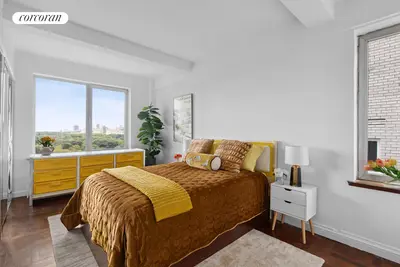
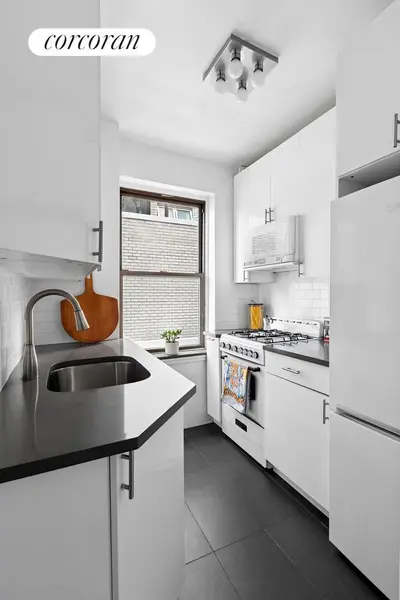
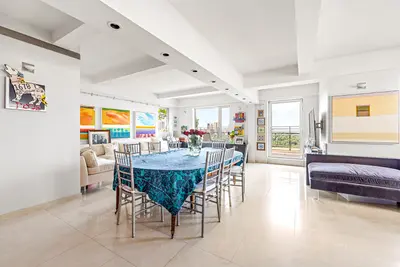
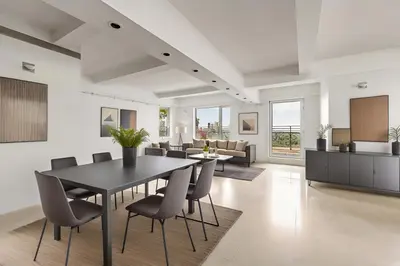
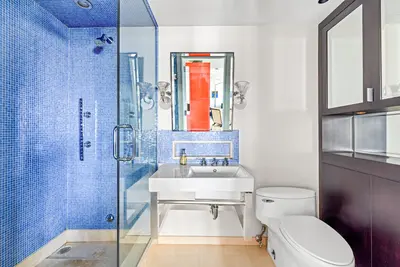
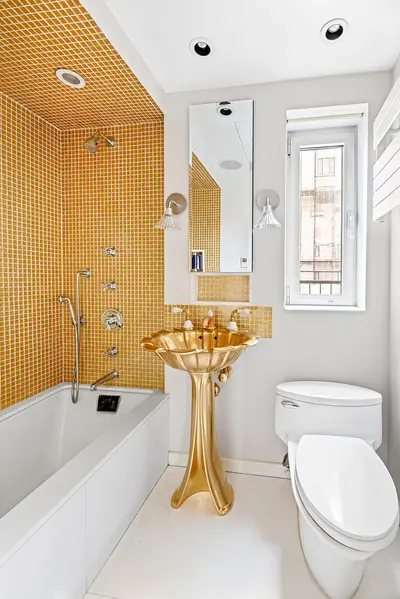
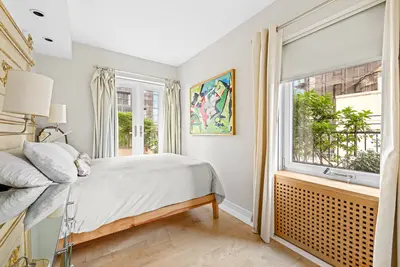
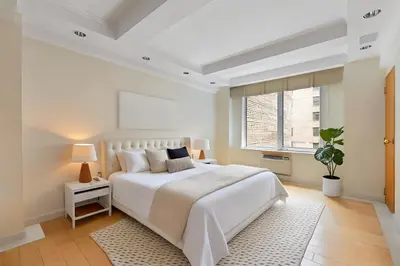
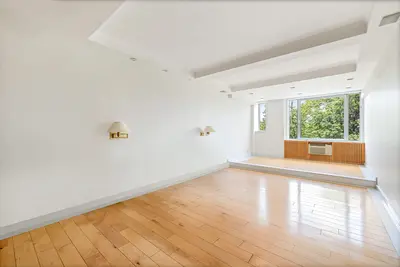
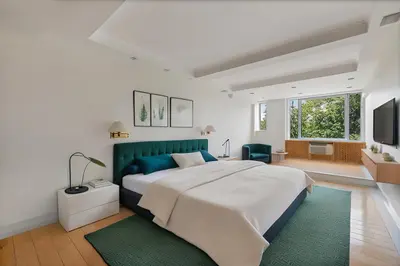
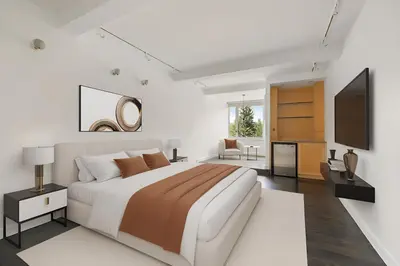
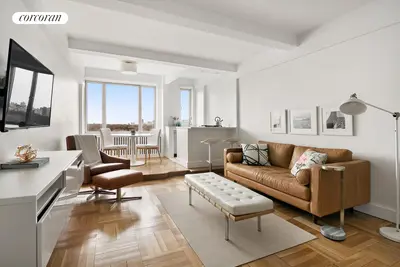
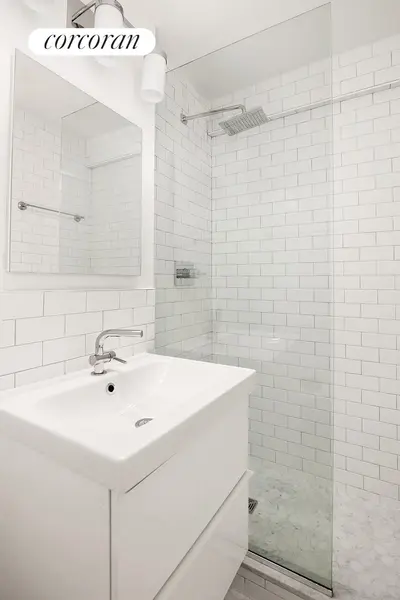
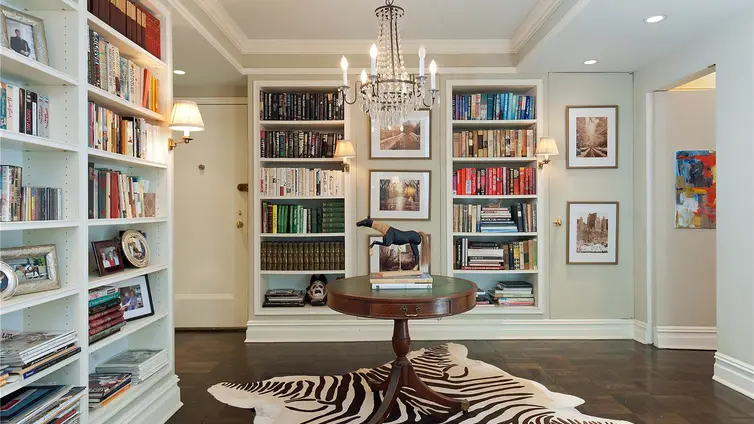
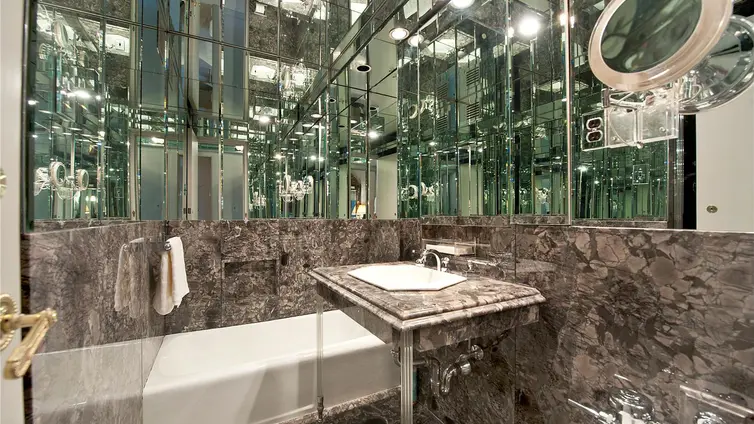
Berkeley House maintains resident-friendly policies including 75% financing allowance, acceptance of pied-à-terre and international buyers, and permission for small pets. The building requires a 3% flip tax paid by buyers and allows in-unit washer/dryers with board approval. Apartments range from efficient studios to sprawling three-bedrooms, many featuring direct park views through oversized windows.


View school info, local attractions, transportation options & more.
Experience amazing 3D aerial maps and fly throughs.
For some co-ops, instead of price per square foot, we use an estimate of the number of rooms for each sold apartment to chart price changes over time. This is because many co-op listings do not include square footage information, and this makes it challenging to calculate accurate square-foot averages.
By displaying the price per estimated room count, we are able to provide a more reliable and consistent metric for comparing sales in the building. While we hope that this gives you a clearer sense of price trends in the building, all data should be independently verified. All data provided are only estimates and should not be used to make any purchase or sale decision.


Broker & Buyer Comments