Park House, 116 Central Park South, NYC - Condo Apartments
- Apartments
- Overview & Photos
- Maps
- Floorplans
- Sales Data & Comps
- Similar Buildings
- All Units
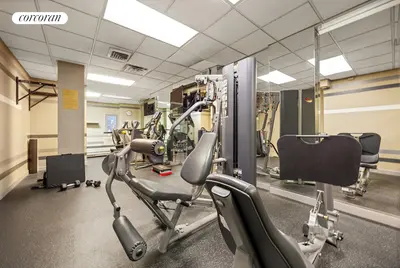
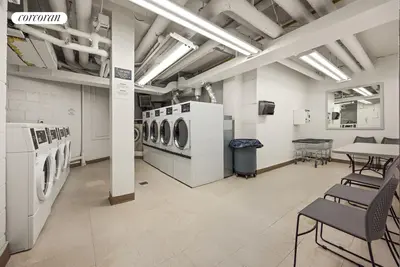
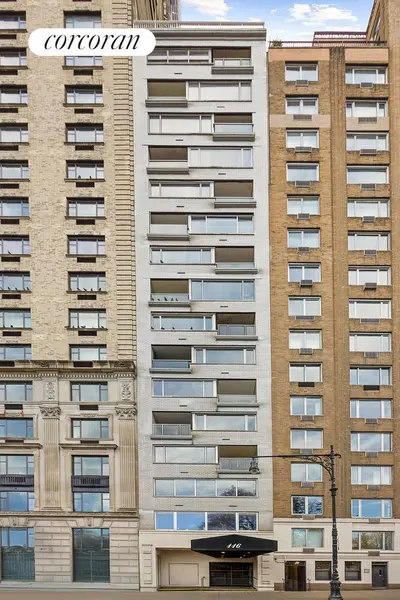
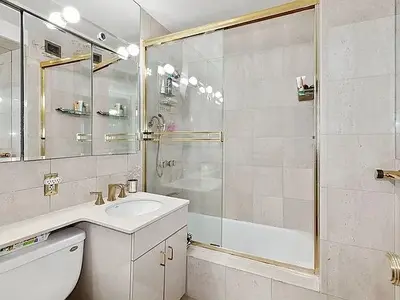
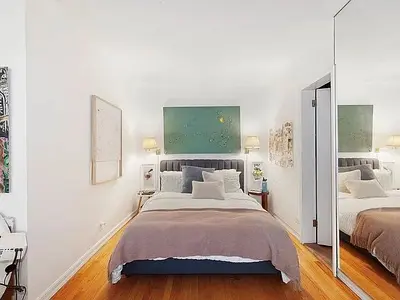
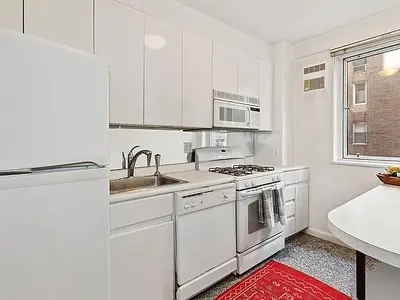
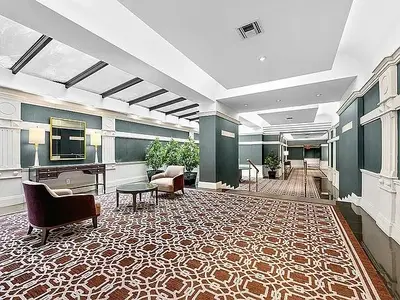
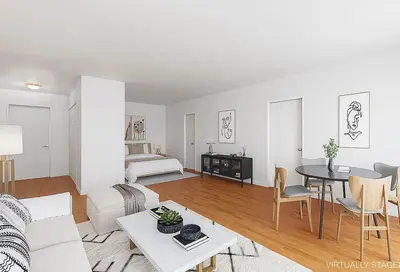
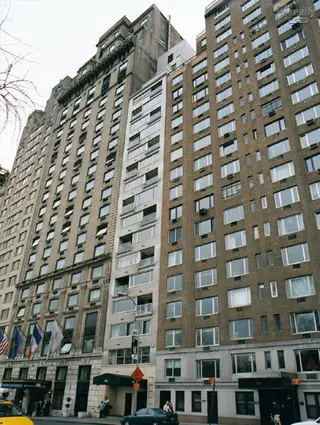
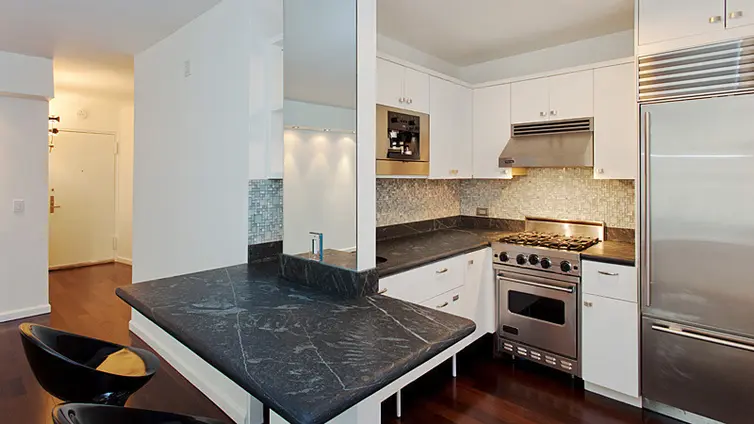
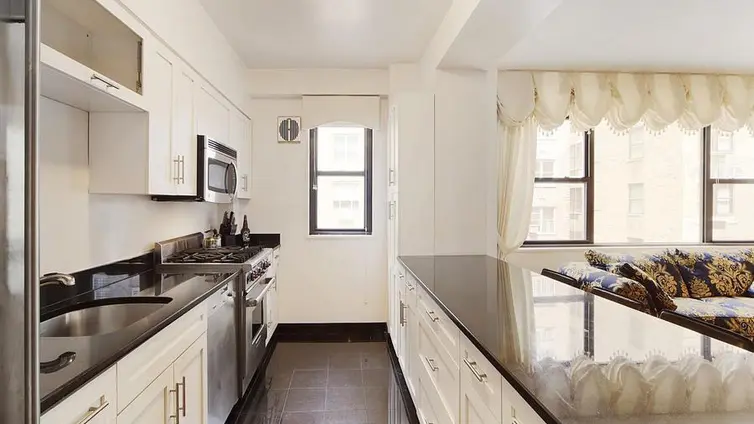
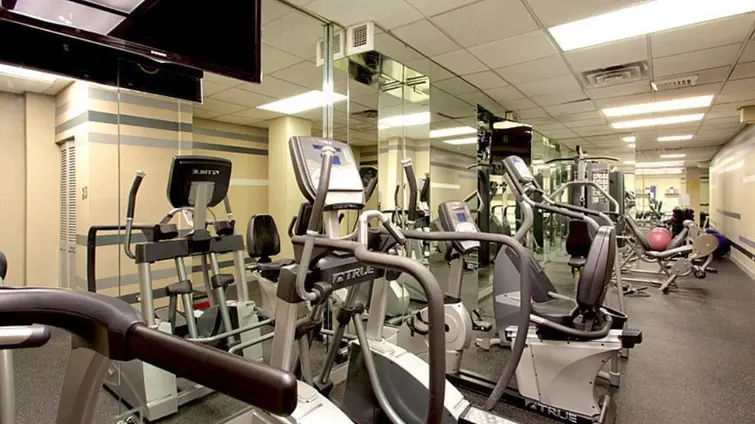
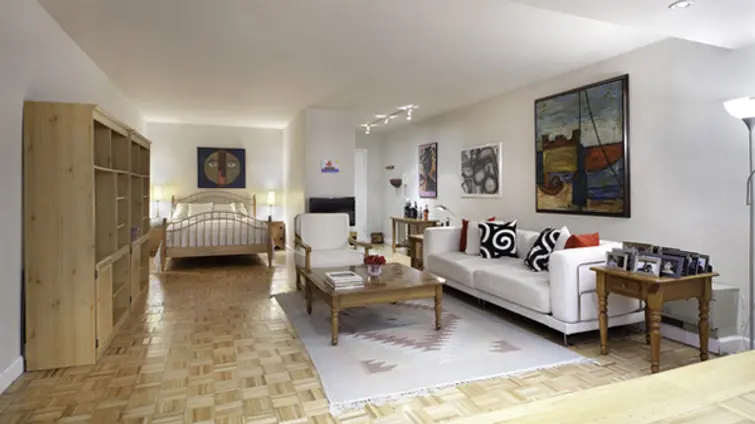
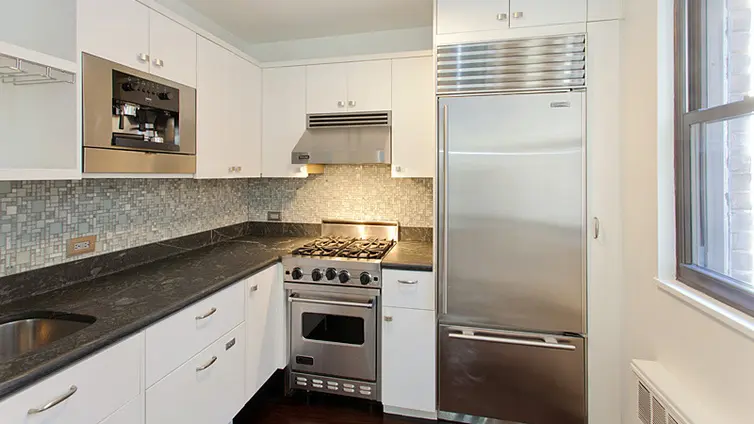
The Park House, located at 116 Central Park South, is a distinguished 17-story condominium with 79 residences. Built in 1962 and converted to a condominium in 1988, this gray-brick building offers residents an array of conveniences, including 24-hour doorman and concierge services, a fitness room, bike storage, a central laundry facility, and on-site parking. Pets are warmly welcomed, and the attentive staff provides mail and package delivery directly to residents’ doors.
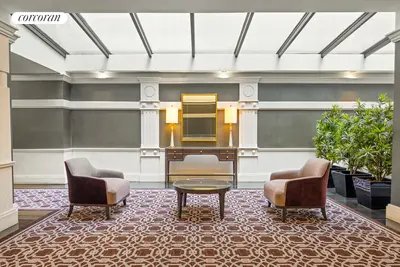
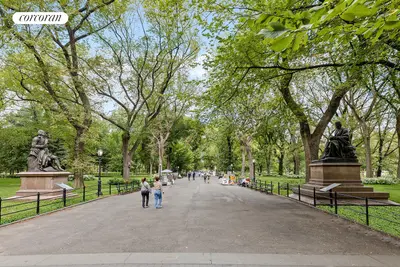
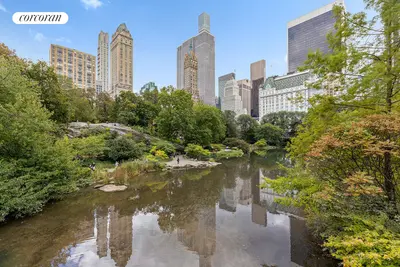
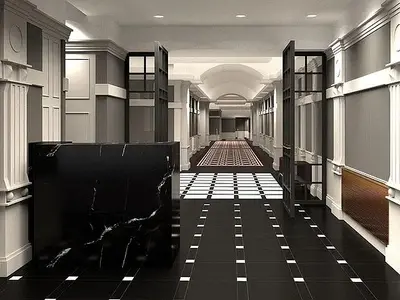
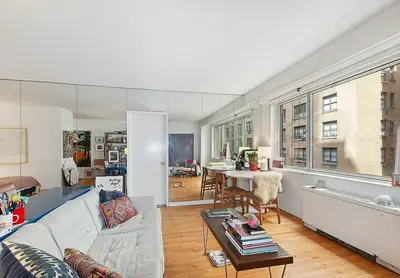
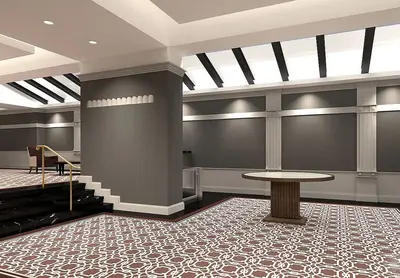
Designed by Zareh Sourian, the building features a modern aesthetic, with a striking vaulted-ceiling lobby, a setback entrance, and distinctive inset balconies on alternate floors. Situated between the Avenue of the Americas and Seventh Avenue, the Park House enjoys proximity to Central Park, world-class shopping along Fifth and Madison Avenues, and the cultural attractions of Lincoln Center. The block is renowned for its iconic architecture, including the Trump Parc, Essex House, and Hampshire House, as well as breathtaking views of Central Park and the surrounding skylines.

View school info, local attractions, transportation options & more.
Experience amazing 3D aerial maps and fly throughs.