Regent House, 25 West 54th Street - Midtown West
- Apartments
- Overview & Photos
- Maps
- Floorplans
- Sales Data & Comps
- Similar Buildings
- All Units
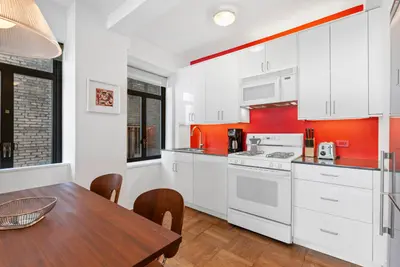
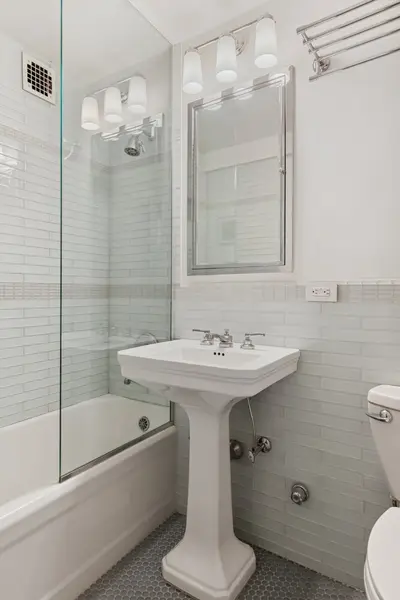
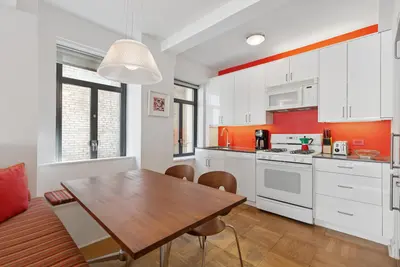
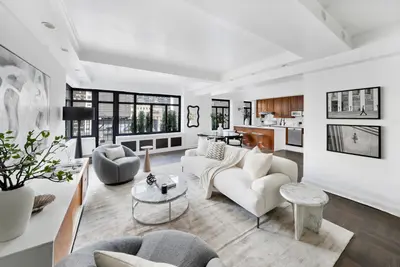
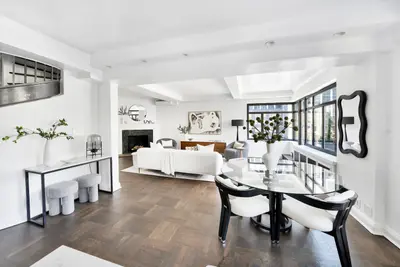
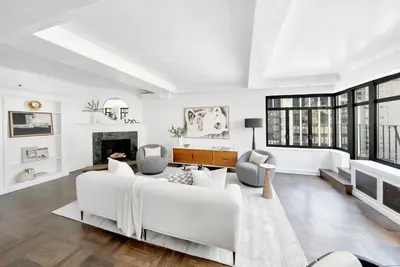
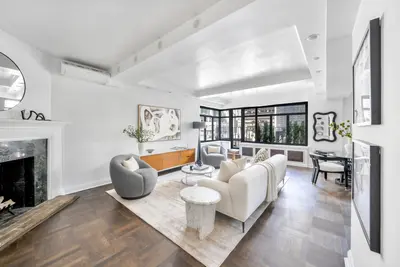
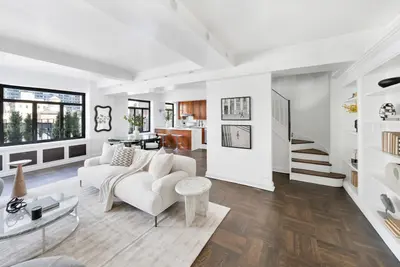
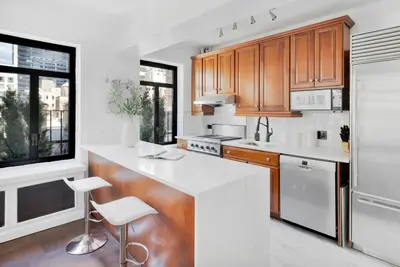
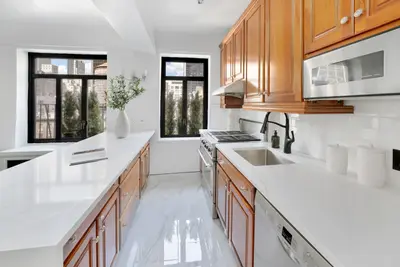


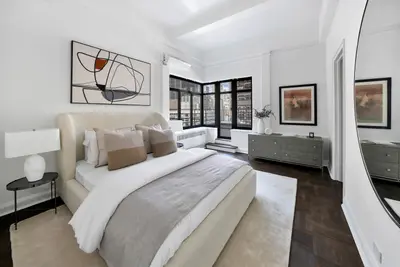

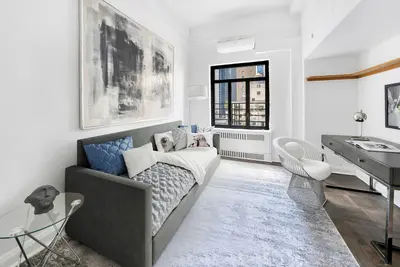
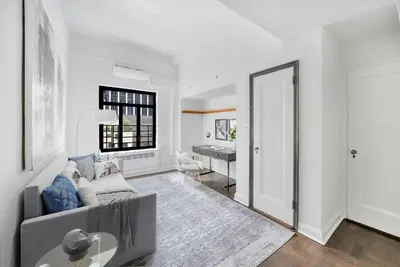
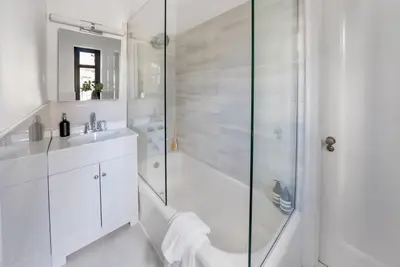
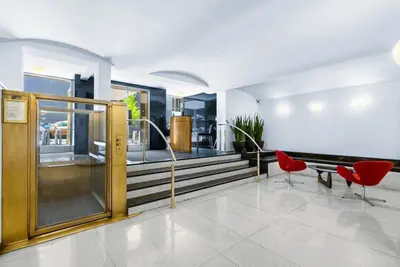
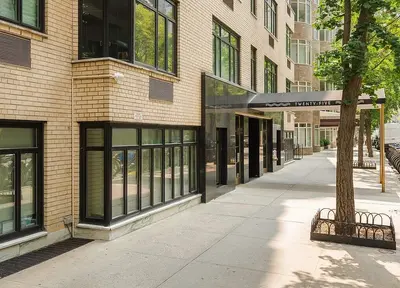
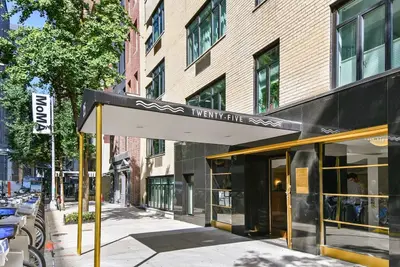
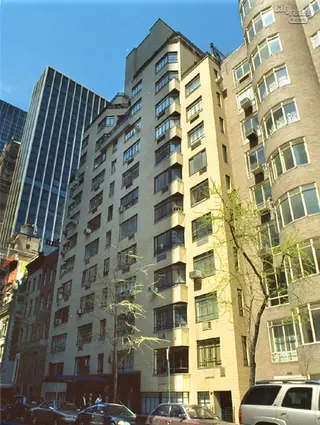
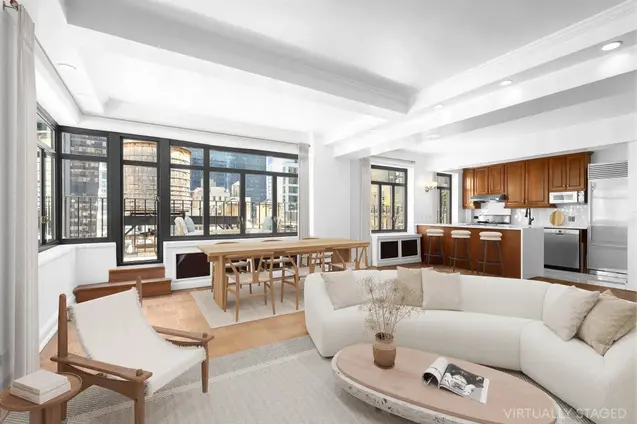
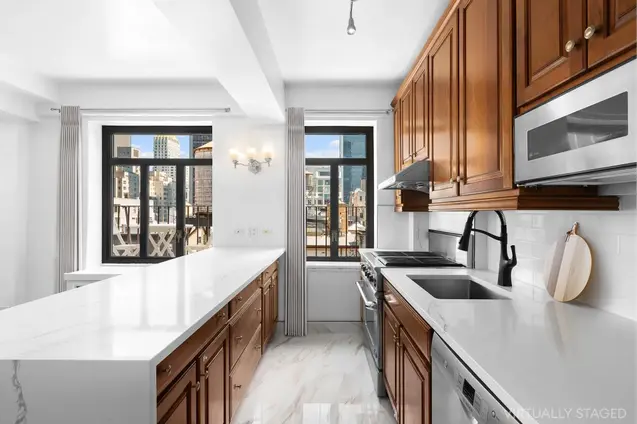
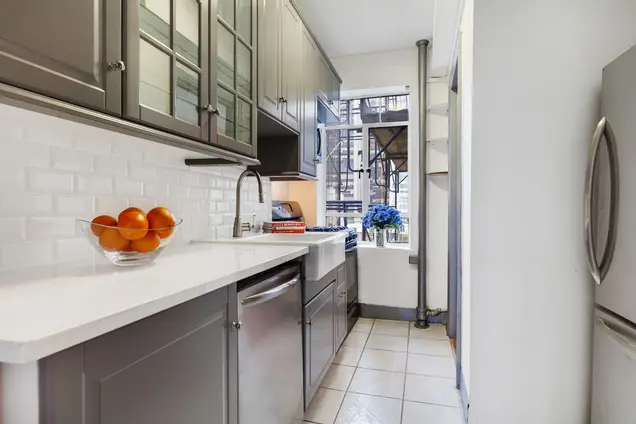
Located directly across from the Sculpture Garden at the Museum of Modern Art, Regent House is a classic Art Deco building completed in 1939 by acclaimed architect William M.D. Dowling. It comprises 65 apartments throughout the 12 stories and penthouse level.
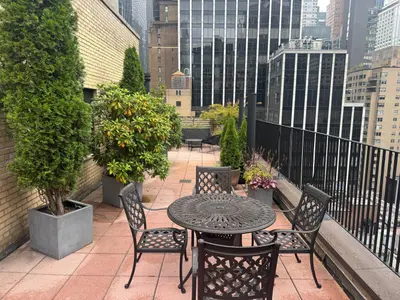
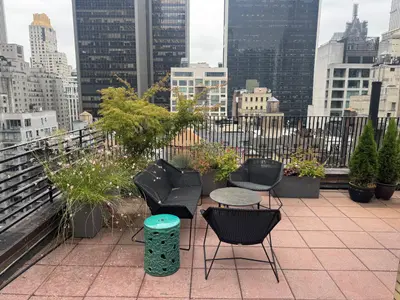
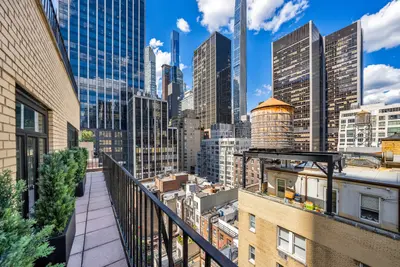
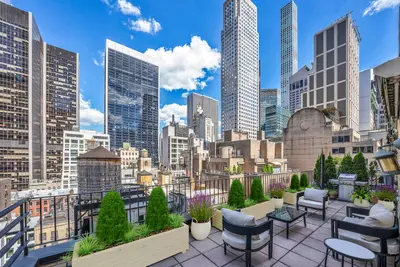
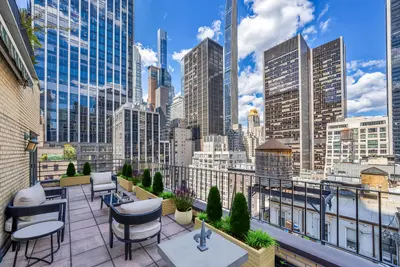
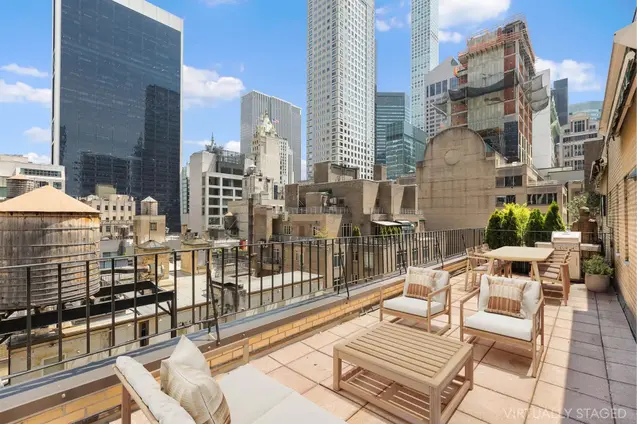
The full-service building welcomes pets and is staffed by at 24-hour doorman, live-in resident manager, handyman, and porters. Amenities include a central laundry room, bike room, storage, back patio, and roof deck with amazing city views. Its address at 25 West 54th Street puts it near Rockefeller Center, Central Park, Fifth Avenue shopping, Carnegie Hall, and public transportation.

View school info, local attractions, transportation options & more.
Experience amazing 3D aerial maps and fly throughs.
For some co-ops, instead of price per square foot, we use an estimate of the number of rooms for each sold apartment to chart price changes over time. This is because many co-op listings do not include square footage information, and this makes it challenging to calculate accurate square-foot averages.
By displaying the price per estimated room count, we are able to provide a more reliable and consistent metric for comparing sales in the building. While we hope that this gives you a clearer sense of price trends in the building, all data should be independently verified. All data provided are only estimates and should not be used to make any purchase or sale decision.
Broker & Buyer Comments