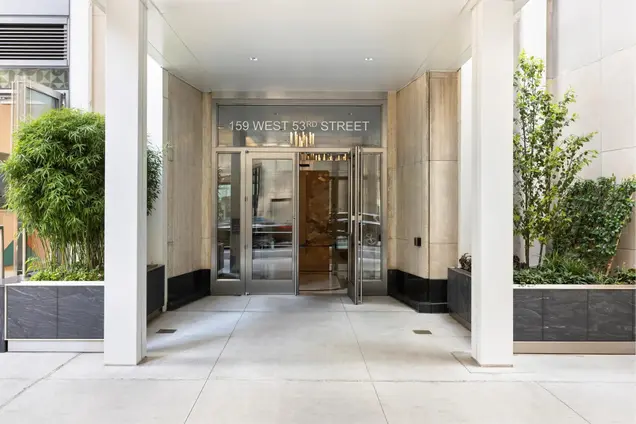
Tower 53, 159 West 53rd Street, NYC - Condo Apartments
- Apartments
- Overview & Photos
- Maps
- Floorplans
- Sales Data & Comps
- Similar Buildings
- All Units

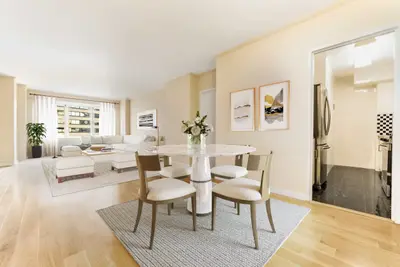
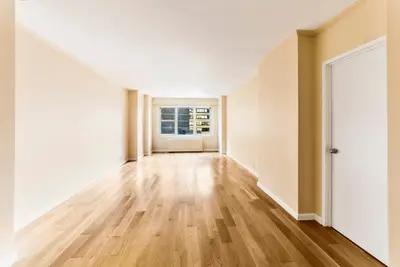
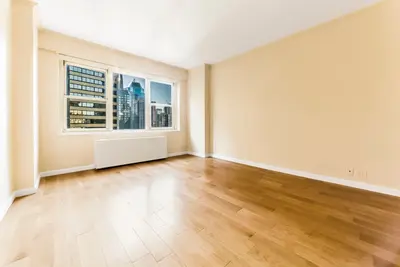
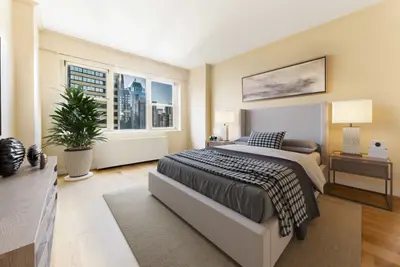
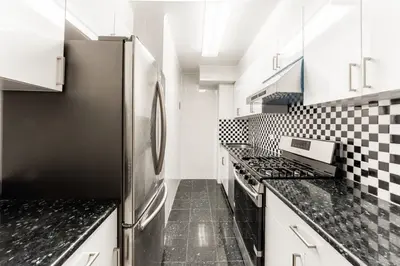
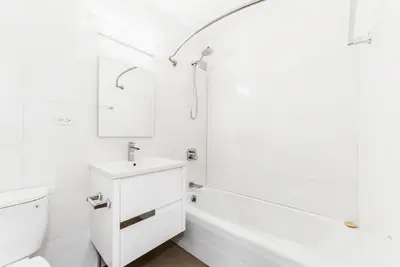

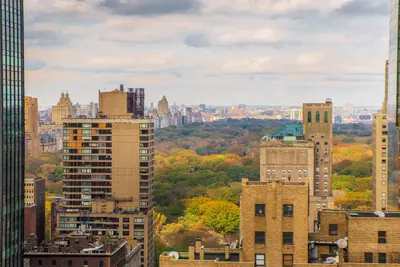
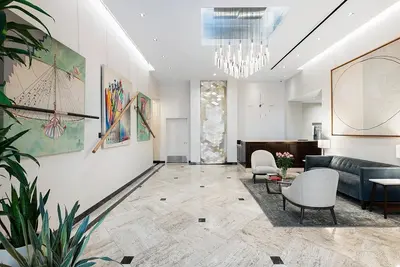
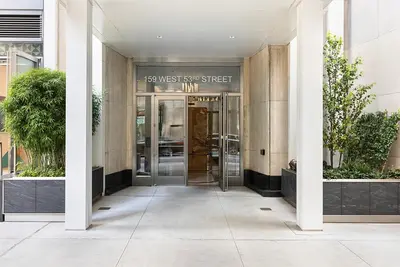
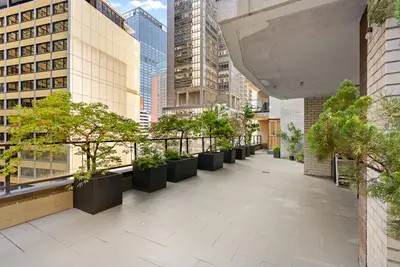
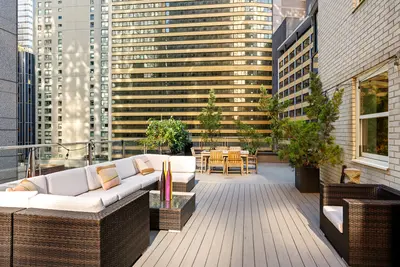
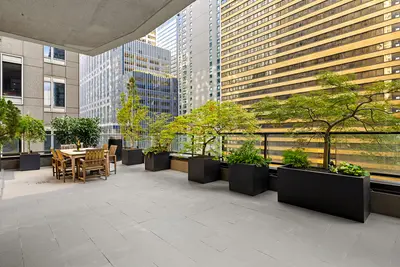
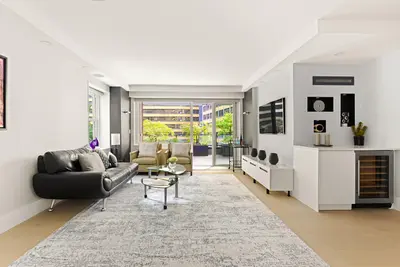
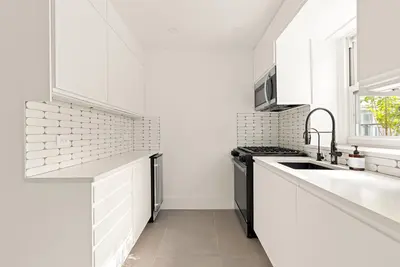

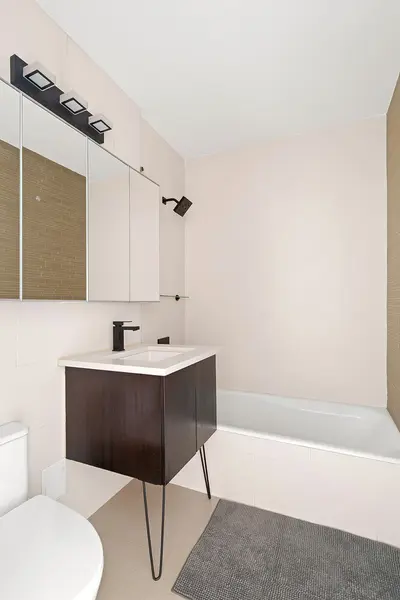
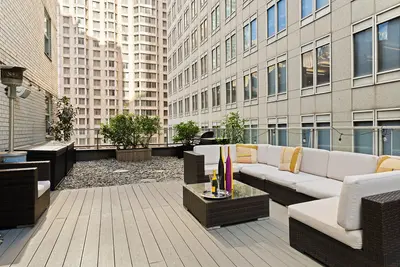
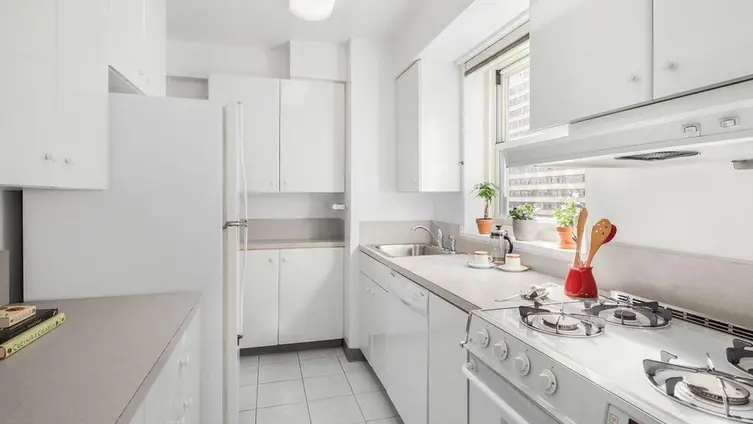
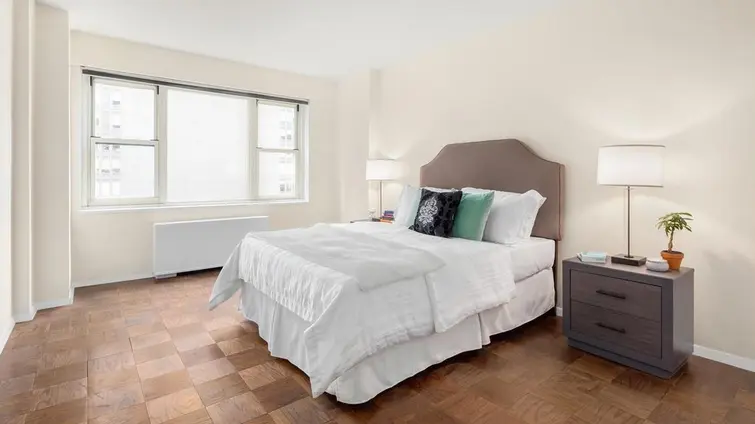
Tower 53 at 159 West 53rd Street is a full-service, post-war condominium offering a 24-hour doorman, concierge, and on-site garage. Residents enjoy a newly renovated lobby, a rooftop deck with sweeping Central Park views, and convenient laundry facilities.
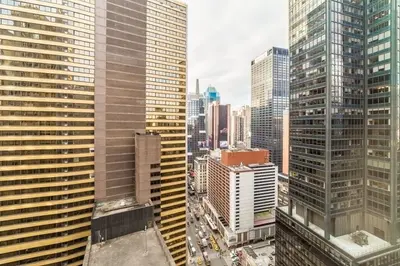
Centrally located in Midtown, the building is steps from world-class shopping, dining, and cultural landmarks, including the Museum of Modern Art, Times Square, Carnegie Hall, and the Theatre District. Major subway lines (1/2/B/D/E/F/N/R/W/Q) provide easy access across the city.
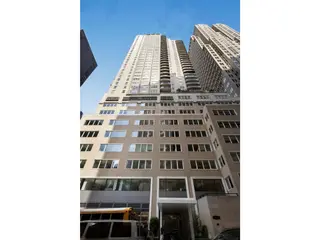
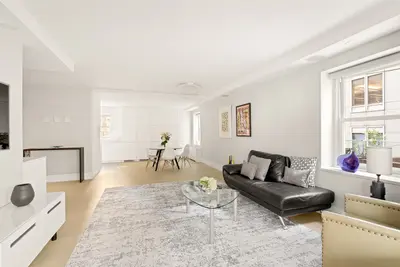
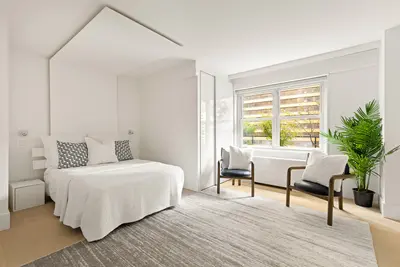
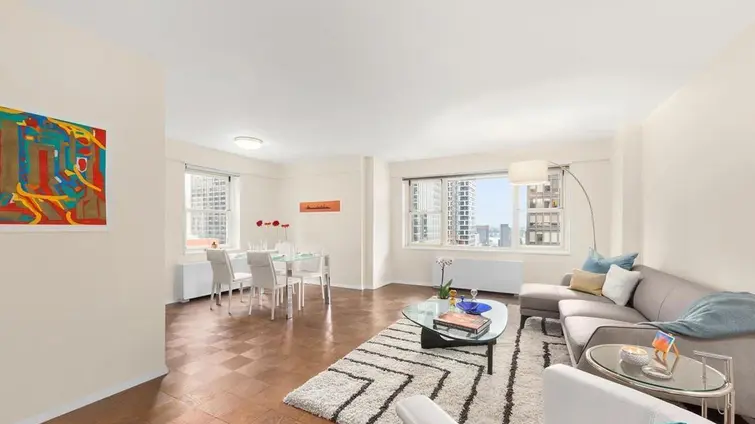
Built in 1968 and converted to a condominium in 1983, this 37-story tower features 213 residences above a commercial base. Many units have balconies, originally with yellow glass railings, updated to clear glass in 2006 along with new windows. The staggered balcony design enhances light and airflow.
Midtown’s revitalization, including the transformation of Times Square and nearby developments like the Equitable Center, has made this area one of the city's most dynamic. Pets are welcome, with dogs up to 35 pounds permitted. Common charges include gas and electric utilities.


View school info, local attractions, transportation options & more.
Experience amazing 3D aerial maps and fly throughs.
Broker & Buyer Comments