600 West 111th Street - Upper West Side
- Apartments
- Overview & Photos
- Maps
- Floorplans
- Sales Data & Comps
- Similar Buildings
- All Units
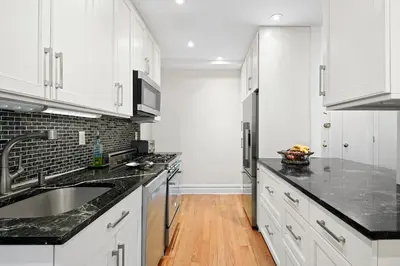
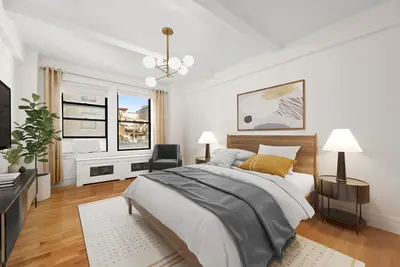
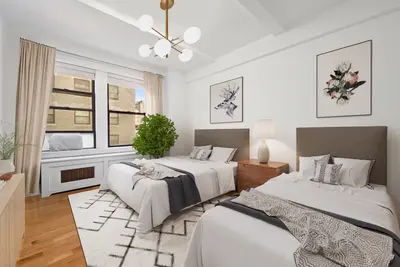
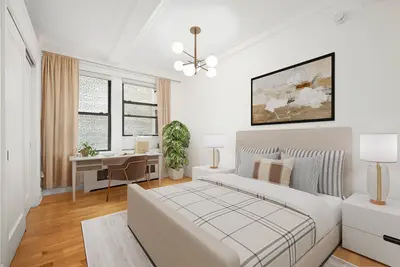
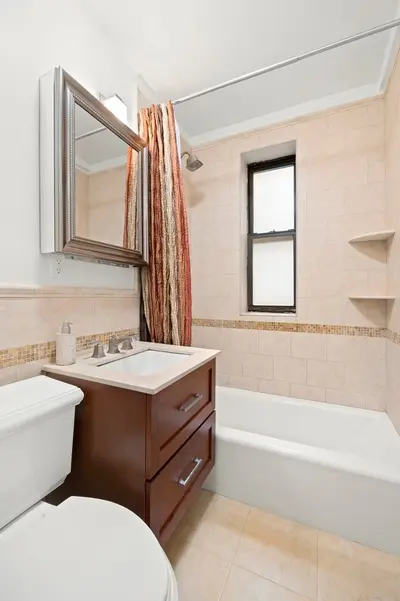
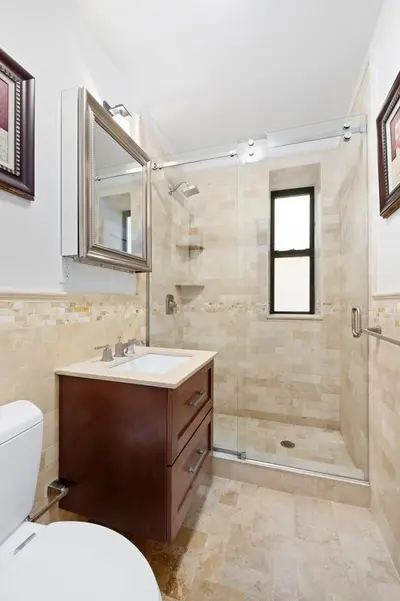
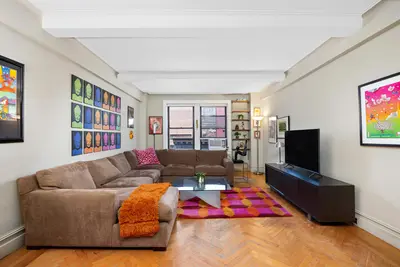
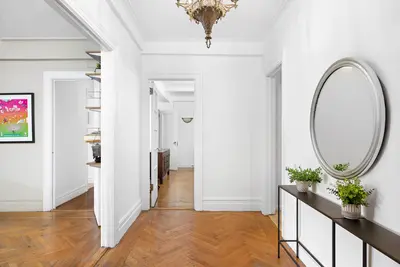


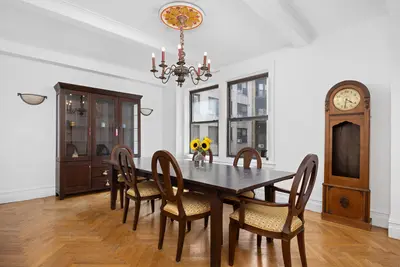
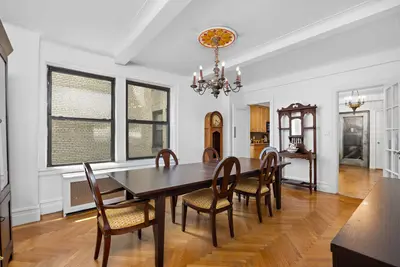
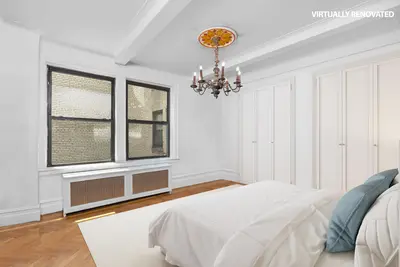
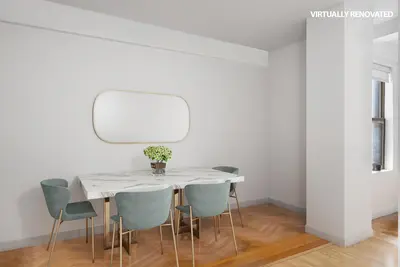
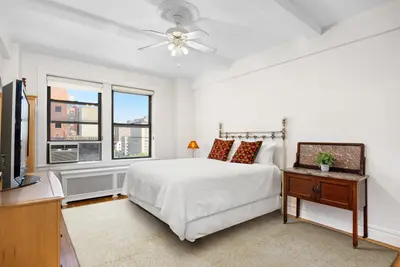

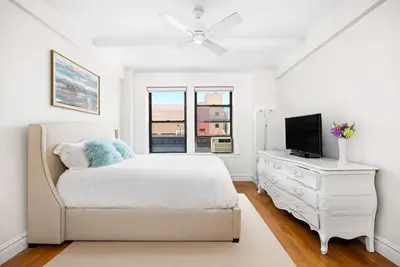
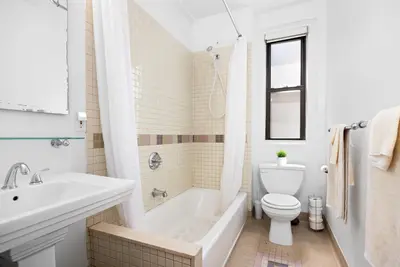
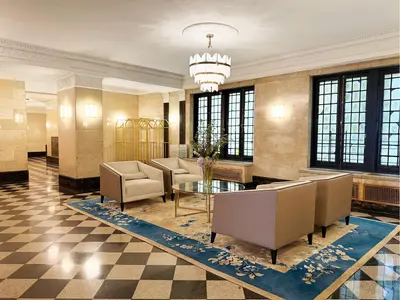
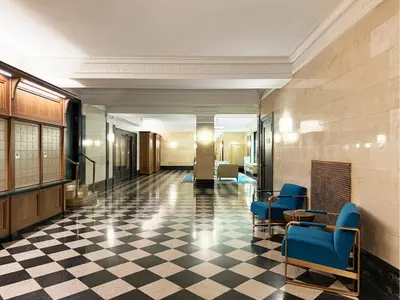
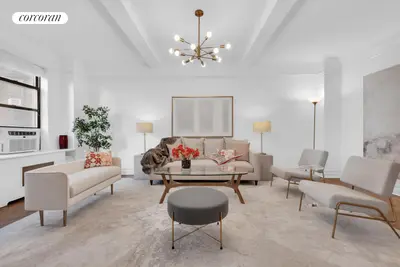
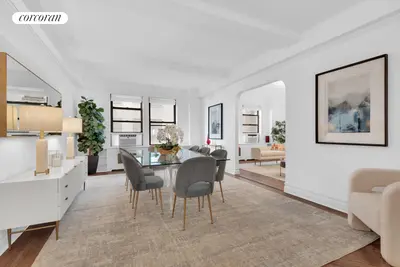
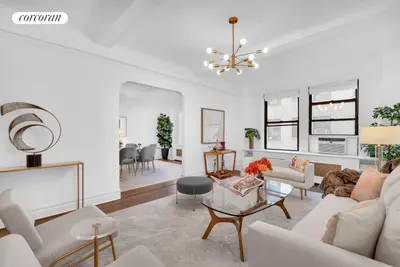
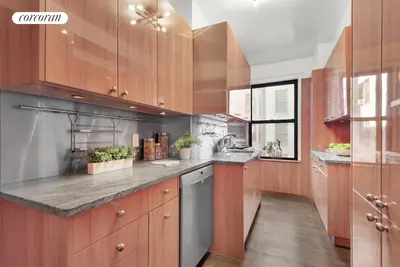
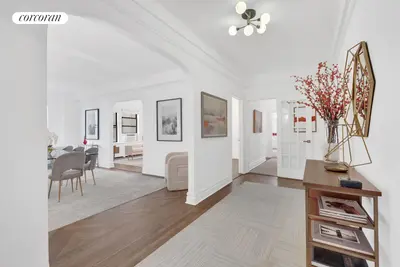
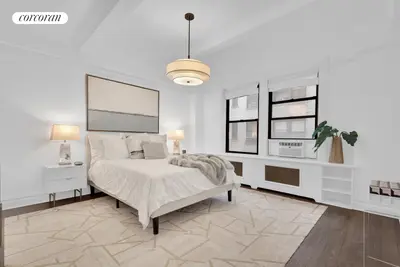
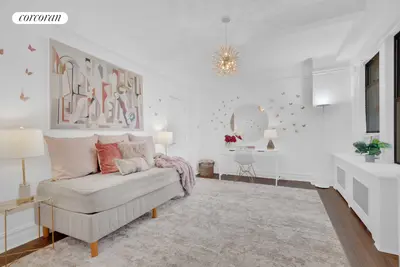
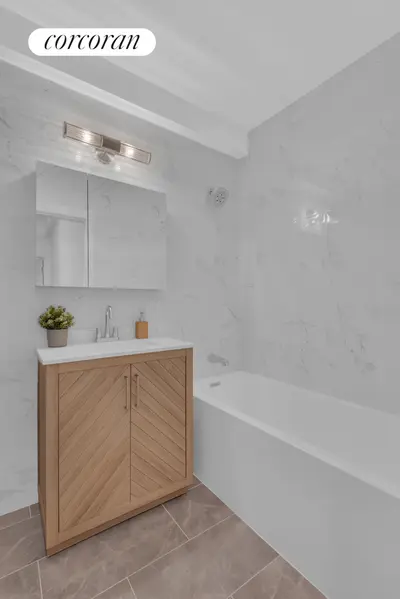
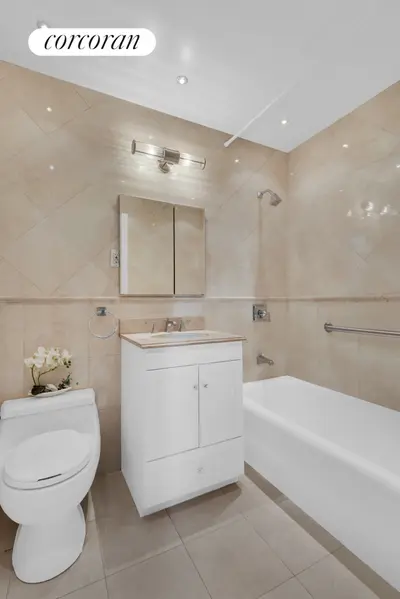
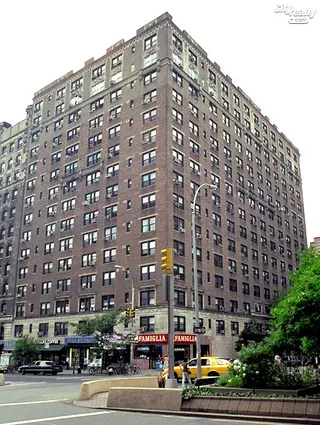
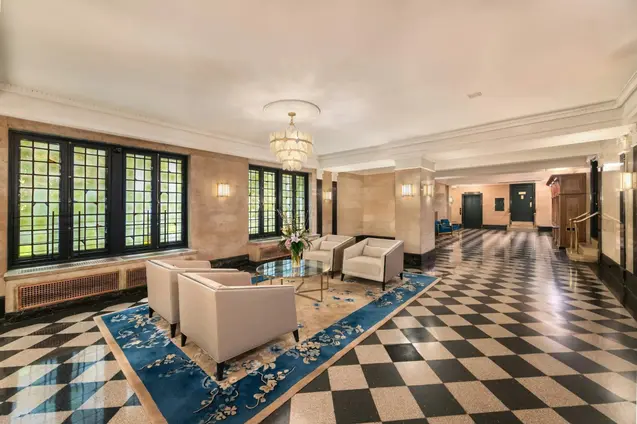
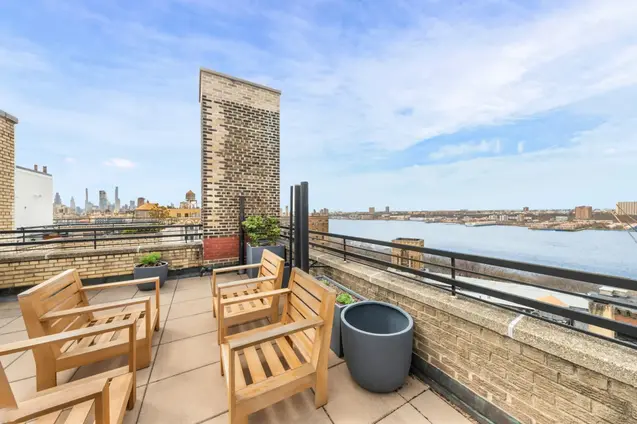
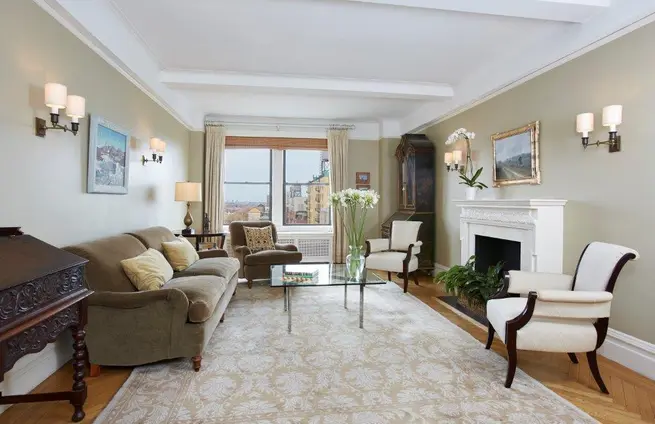
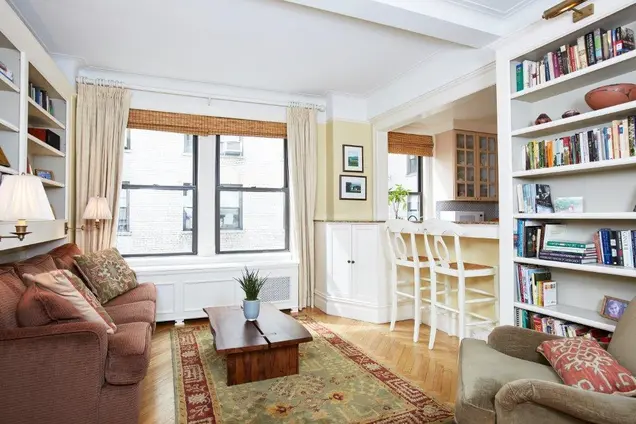
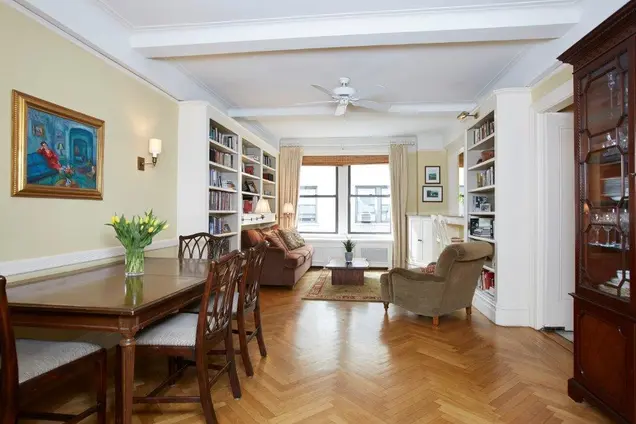
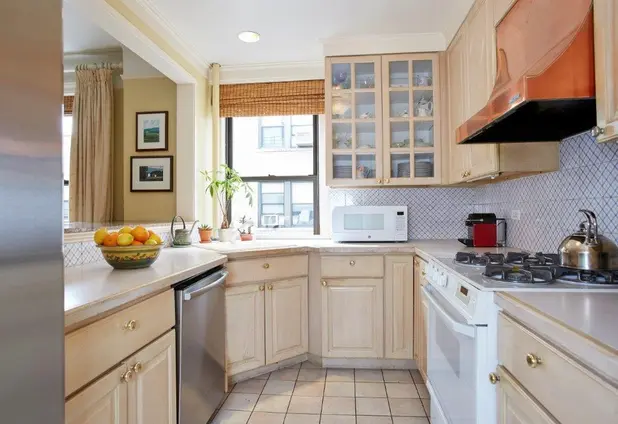
600 West 111th Street is a distinguished pre-war cooperative nestled between Broadway and Riverside Drive, where the Upper West Side meets historic Morningside Heights. Built in 1920 and converted in 1988, this 16-story, full-service building offers 147 residences and an array of modern conveniences while preserving its classic charm.
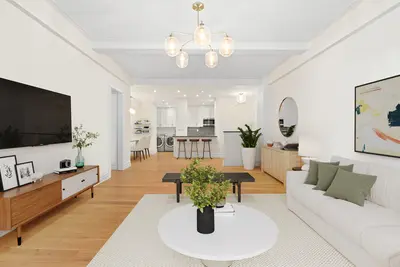
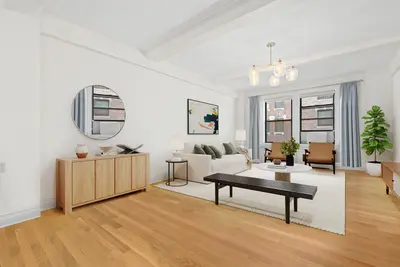
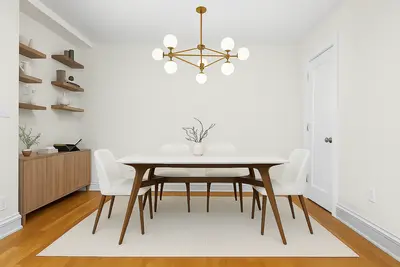
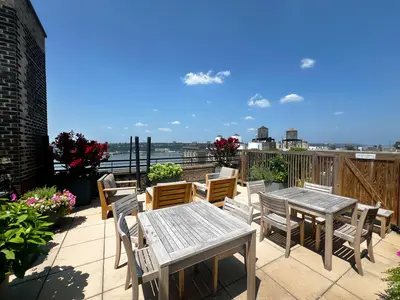
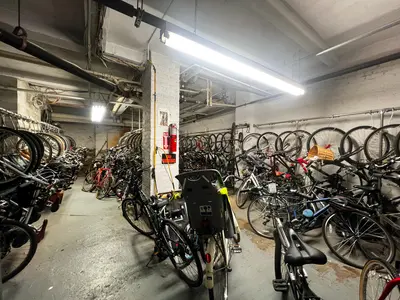
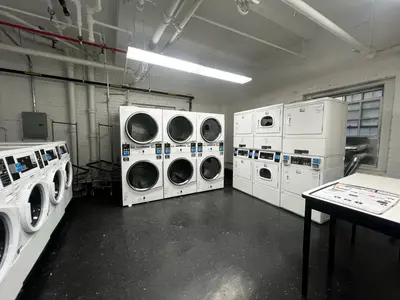
Residents enjoy a 24-hour doorman, live-in superintendent, newly renovated lobby, landscaped roof deck with stunning views, bicycle room, laundry facilities, storage cages, and strong financials. Pets are welcome, and the building permits up to 75% financing, in-unit washer/dryers, through-wall A/C, and subletting for 2 out of every 5 years. Guarantors, gifting, co-purchasing, and trust purchases are considered on a case-by-case basis.
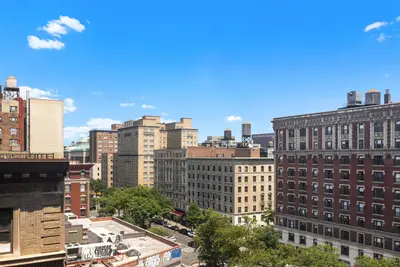
Perfectly located, 600 West 111th Street is just steps from Riverside Park, Morningside Park, and Central Park, as well as top restaurants, charming bookstores, cafes, and premier grocery stores like H Mart and Westside Market. The 1 train and crosstown bus are just a block away, offering easy access to the rest of the city. With Columbia University and Barnard College nearby, this vibrant neighborhood blends historic character with modern convenience.

View school info, local attractions, transportation options & more.
Experience amazing 3D aerial maps and fly throughs.
For some co-ops, instead of price per square foot, we use an estimate of the number of rooms for each sold apartment to chart price changes over time. This is because many co-op listings do not include square footage information, and this makes it challenging to calculate accurate square-foot averages.
By displaying the price per estimated room count, we are able to provide a more reliable and consistent metric for comparing sales in the building. While we hope that this gives you a clearer sense of price trends in the building, all data should be independently verified. All data provided are only estimates and should not be used to make any purchase or sale decision.