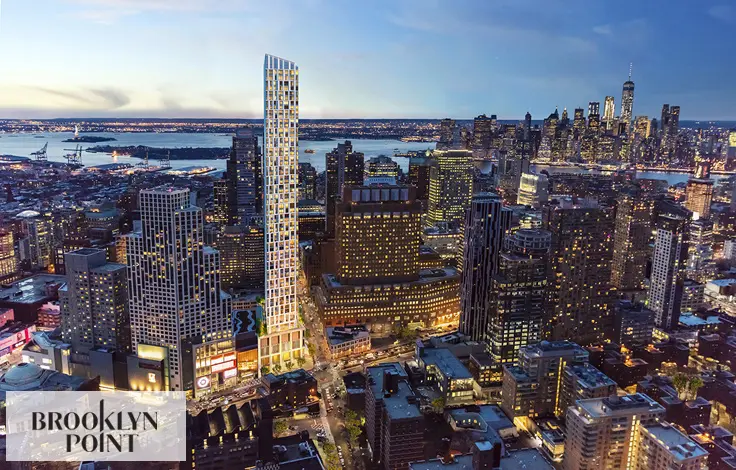
80 La Salle Street: Price Comparison
between Amsterdam Avenue & Broadway Building Profile
80 La Salle Street
$698,333
Avg. Price
Past 12 months
Past 12 months
2023
$571,938
2022
$483,333
2021
$467,500
2020
-
2019
$594,861
2018
$629,756
2017
$543,325
2016
$524,857
2015
$463,000
2014
$392,000
2013
$424,344
2012
$365,333
2011
-
2010
-
2009
$771,200
2008
$276,300
2007
$359,104
2006
$278,800
2005
-
2004
$78,933
2003
-
80 La Salle Street
$655,000
Median Price
Past 12 months
Past 12 months
2023
$474,000
2022
$475,000
2021
$425,000
2020
-
2019
$545,000
2018
$610,000
2017
$559,900
2016
$505,000
2015
$392,500
2014
$328,000
2013
$375,000
2012
$329,000
2011
-
2010
-
2009
$771,200
2008
$276,300
2007
$330,067
2006
$278,800
2005
-
2004
$82,600
2003
-
80 La Salle Street
$340,000
Avg. Price
Past 12 months
Past 12 months
2023
$307,500
2022
-
2021
-
2020
-
2019
$332,500
2018
$285,000
2017
$257,500
2016
$280,000
2015
$249,000
2014
$193,000
2013
$187,000
2012
-
2011
-
2010
-
2009
-
2008
-
2007
-
2006
-
2005
-
2004
-
2003
-
80 La Salle Street
$340,000
Median Price
Past 12 months
Past 12 months
2023
$307,500
2022
-
2021
-
2020
-
2019
$332,500
2018
$285,000
2017
$257,500
2016
$280,000
2015
$249,000
2014
$193,000
2013
$187,000
2012
-
2011
-
2010
-
2009
-
2008
-
2007
-
2006
-
2005
-
2004
-
2003
-
80 La Salle Street
$655,000
Avg. Price
Past 12 months
Past 12 months
2023
$481,600
2022
$483,333
2021
$427,000
2020
-
2019
$502,813
2018
$590,000
2017
$559,900
2016
$487,800
2015
$395,500
2014
$338,667
2013
$347,250
2012
$302,000
2011
-
2010
-
2009
-
2008
$276,300
2007
$313,323
2006
-
2005
-
2004
$78,933
2003
-
80 La Salle Street
$655,000
Median Price
Past 12 months
Past 12 months
2023
$449,000
2022
$475,000
2021
$420,000
2020
-
2019
$520,625
2018
$590,000
2017
$559,900
2016
$505,000
2015
$392,500
2014
$328,000
2013
$354,500
2012
$302,000
2011
-
2010
-
2009
-
2008
$276,300
2007
$320,034
2006
-
2005
-
2004
$82,600
2003
-
80 La Salle Street
N/A
Avg. Price
Past 12 months
Past 12 months
2023
$735,000
2022
-
2021
$670,000
2020
-
2019
$752,500
2018
$780,000
2017
$796,000
2016
-
2015
-
2014
-
2013
$560,775
2012
$492,000
2011
-
2010
-
2009
$771,200
2008
-
2007
$542,230
2006
$278,800
2005
-
2004
-
2003
-
80 La Salle Street
N/A
Median Price
Past 12 months
Past 12 months
2023
$735,000
2022
-
2021
$670,000
2020
-
2019
$750,000
2018
$780,000
2017
$796,000
2016
-
2015
-
2014
-
2013
$539,050
2012
$492,000
2011
-
2010
-
2009
$771,200
2008
-
2007
$542,230
2006
$278,800
2005
-
2004
-
2003
-
80 La Salle Street
$1,100,000
Avg. Price
Past 12 months
Past 12 months
2023
$1,125,000
2022
-
2021
-
2020
-
2019
-
2018
$950,933
2017
-
2016
$955,000
2015
$746,500
2014
$890,000
2013
-
2012
-
2011
-
2010
-
2009
-
2008
-
2007
-
2006
-
2005
-
2004
-
2003
-
80 La Salle Street
$1,100,000
Median Price
Past 12 months
Past 12 months
2023
$1,125,000
2022
-
2021
-
2020
-
2019
-
2018
$932,800
2017
-
2016
$955,000
2015
$746,500
2014
$890,000
2013
-
2012
-
2011
-
2010
-
2009
-
2008
-
2007
-
2006
-
2005
-
2004
-
2003
-
80 La Salle Street
N/A
Avg. Price
Past 12 months
Past 12 months
2023
-
2022
-
2021
-
2020
-
2019
-
2018
-
2017
-
2016
-
2015
-
2014
-
2013
-
2012
-
2011
-
2010
-
2009
-
2008
-
2007
-
2006
-
2005
-
2004
-
2003
-
80 La Salle Street
N/A
Median Price
Past 12 months
Past 12 months
2023
-
2022
-
2021
-
2020
-
2019
-
2018
-
2017
-
2016
-
2015
-
2014
-
2013
-
2012
-
2011
-
2010
-
2009
-
2008
-
2007
-
2006
-
2005
-
2004
-
2003
-
80 La Salle Street
N/A
Avg. Price
Past 12 months
Past 12 months
2023
-
2022
-
2021
-
2020
-
2019
-
2018
-
2017
-
2016
-
2015
-
2014
-
2013
-
2012
-
2011
-
2010
-
2009
-
2008
-
2007
-
2006
-
2005
-
2004
-
2003
-
80 La Salle Street
N/A
Median Price
Past 12 months
Past 12 months
2023
-
2022
-
2021
-
2020
-
2019
-
2018
-
2017
-
2016
-
2015
-
2014
-
2013
-
2012
-
2011
-
2010
-
2009
-
2008
-
2007
-
2006
-
2005
-
2004
-
2003
-


 6sqft delivers the latest on real estate, architecture, and design, straight from New York City.
