Shh... Many units sell without being publicly listed.
Explore off-market possibilities at Fowler Court – inquire to find out about residences with owners open to private offers!
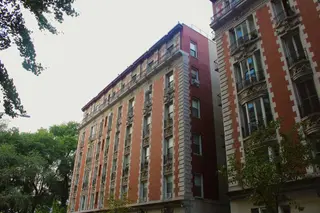
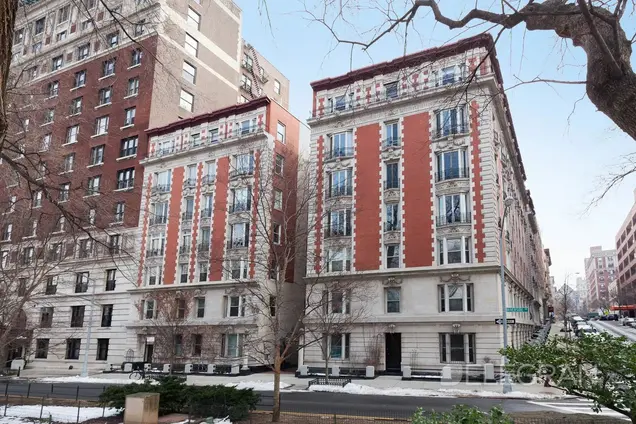
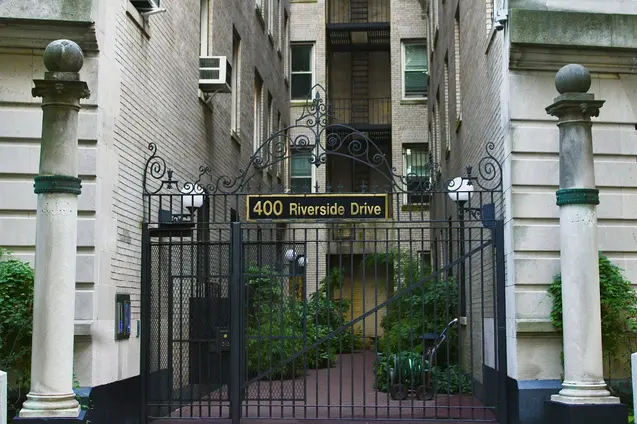
Built in 1908, Fowler Court is a beautiful Neoclassical prewar cooperative conveniently situated across Riverside Park and the Hudson River, and within easy access to Columbia University, Central Park, and all neighborhood amenities and transportation. Surrounded by the gorgeous prewar architecture that is distinctive to the neighborhood, this building also offers a friendly on-site resident manager, video intercom security system, a lovely garden, bicycle storage room and common laundry room. Pets and pied-a-terres are allowed.
Explore off-market possibilities at Fowler Court – inquire to find out about residences with owners open to private offers!

View school info, local attractions, transportation options & more.
Experience amazing 3D aerial maps and fly throughs.
For some co-ops, instead of price per square foot, we use an estimate of the number of rooms for each sold apartment to chart price changes over time. This is because many co-op listings do not include square footage information, and this makes it challenging to calculate accurate square-foot averages.
By displaying the price per estimated room count, we are able to provide a more reliable and consistent metric for comparing sales in the building. While we hope that this gives you a clearer sense of price trends in the building, all data should be independently verified. All data provided are only estimates and should not be used to make any purchase or sale decision.
|
Year
Avg Price / Ft2 (Est)
Median Price / Ft2 (Est)
Avg. Actual Price
Med. Actual Price
Transactions
2025
$242
$435,000
$242
$435,000
1
2024
$1,124
$931,250
$1,124
$900,000
4
2023
-
$1,795,000
-
$1,795,000
1
2022
$870
$1,150,000
$870
$1,150,000
1
2021
$829
$752,500
$829
$752,500
2
2020
-
-
-
-
0
2019
$781
$637,000
$781
$637,000
2
2018
$1,533
$2,300,000
$1,533
$2,300,000
1
2017
$993
$662,500
$993
$662,500
2
2016
$1,000
$1,315,000
$1,000
$1,315,000
2
2015
-
$2,506,250
-
$2,506,250
1
2014
-
$690,000
-
$690,000
1
|
Year
Avg Price / Ft2 (Est)
Median Price / Ft2 (Est)
Avg. Actual Price
Med. Actual Price
Transactions
2013
$780
$780,000
$780
$780,000
1
2012
$747
$789,167
$747
$725,000
3
2011
$714
$895,000
$759
$700,000
3
2010
$903
$542,000
$903
$542,000
1
2009
-
-
-
-
0
2008
$803
$684,500
$803
$689,000
3
2007
$903
$1,625,000
$903
$1,625,000
2
2006
$957
$1,435,000
$957
$1,435,000
1
2005
$862
$977,500
$862
$1,140,000
3
2004
-
-
-
-
0
2003
-
-
-
-
0
Please note that price/ft2 calculations is from only 60% of total transactions during the period
|
the following is a slider of images. For screen reader users, all slides are visible at all time so you may ignore control buttons.
Sign-up and we'll email you new listings in this building!
Whether you’re a buyer, investor, or simply curious, this report is your key to unlocking in-depth insights and analysis on .
Please confirm your details:
