Goodhue House, 20 East 35th Street - Murray Hill
- Apartments
- Overview & Photos
- Maps
- Floorplans
- Sales Data & Comps
- Similar Buildings
- All Units
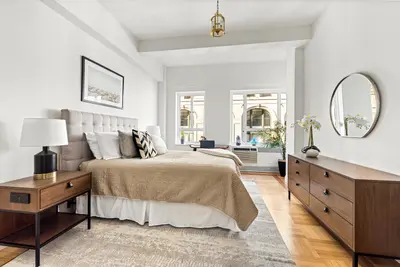
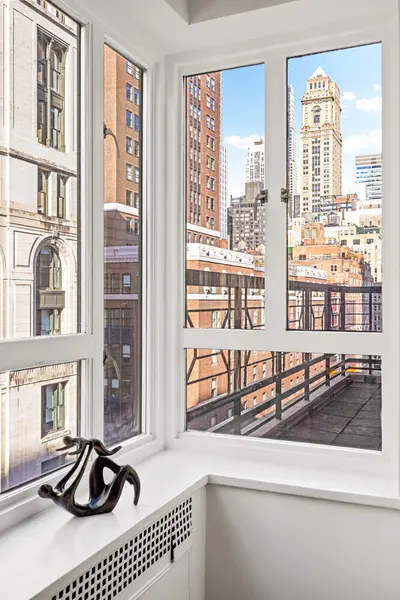
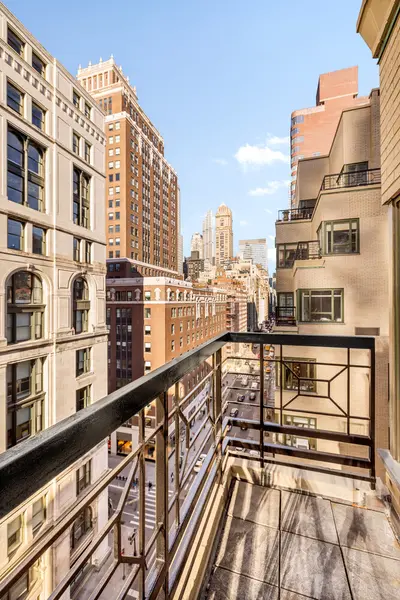
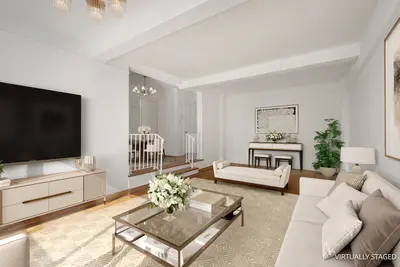
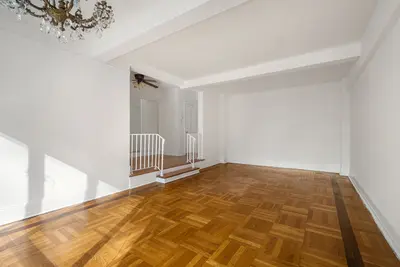
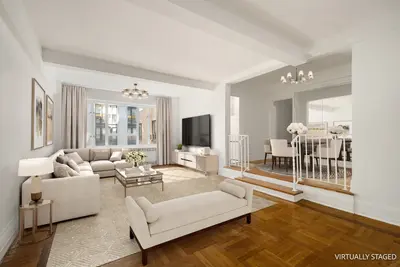
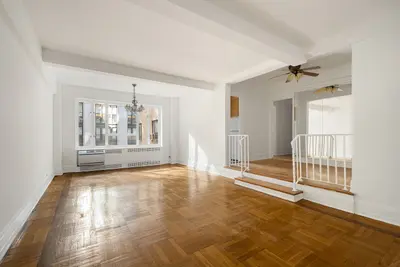
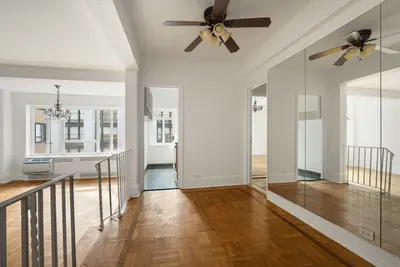
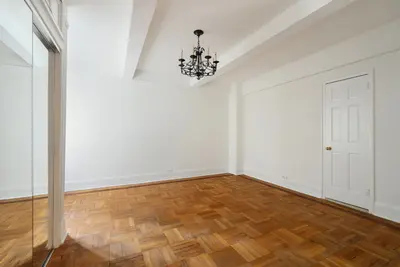
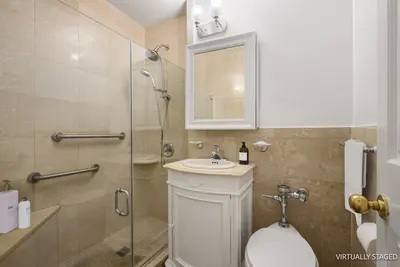
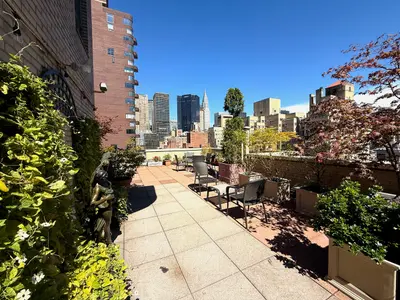
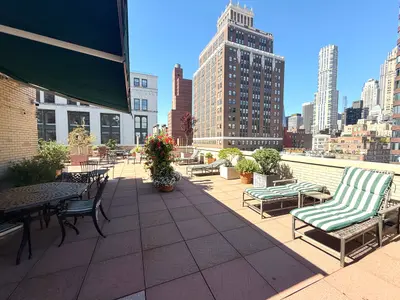
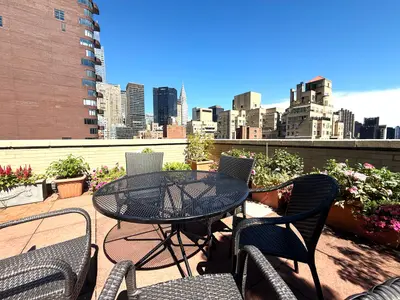
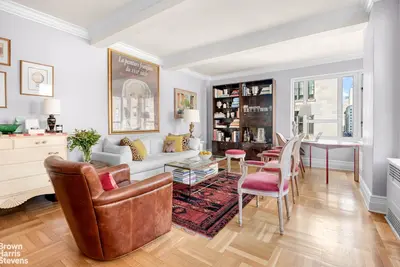
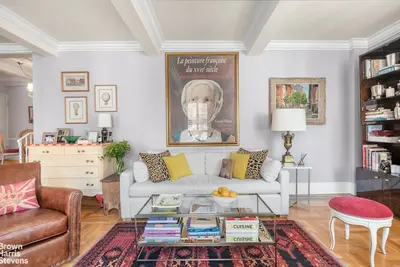
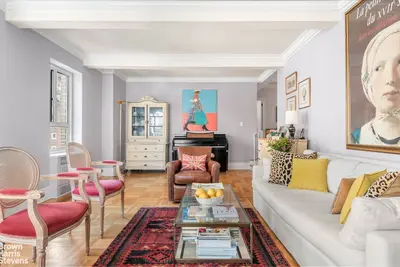
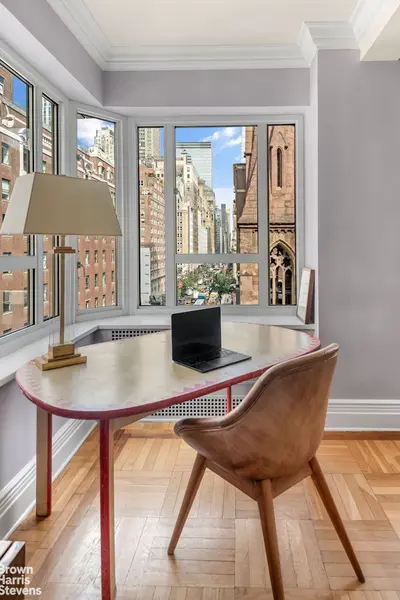
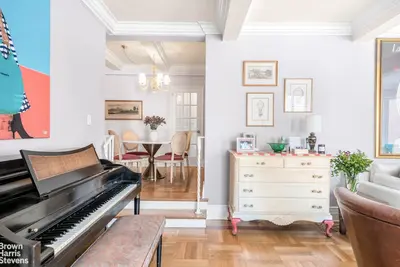
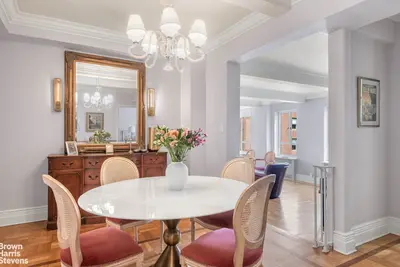
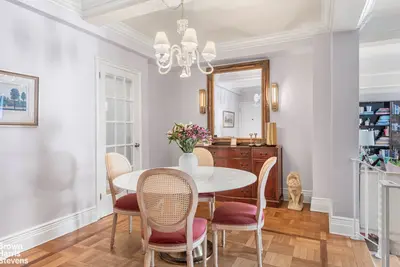
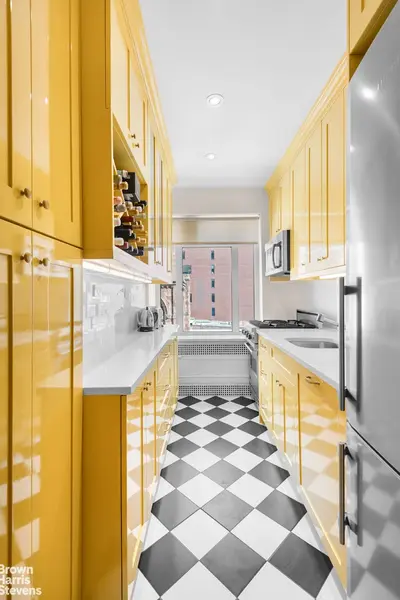

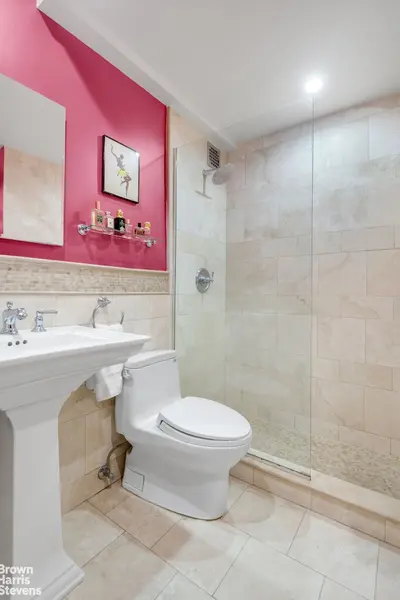
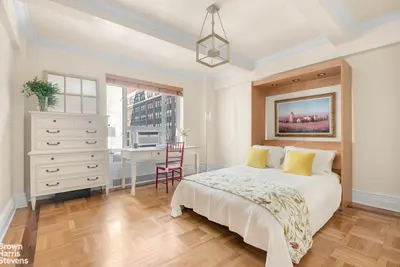
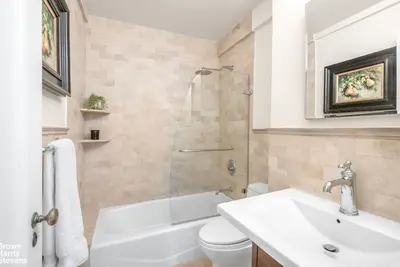
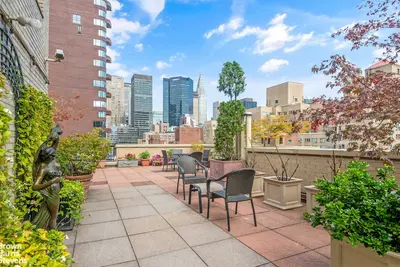
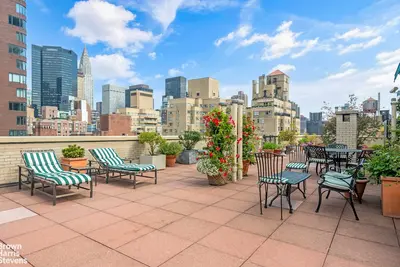
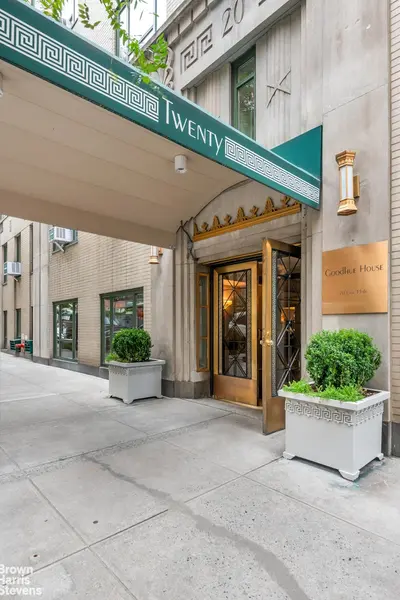
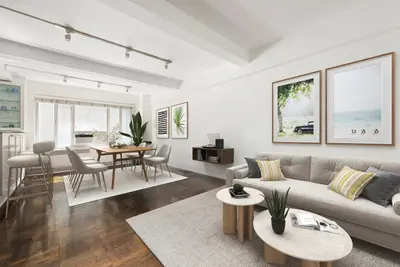
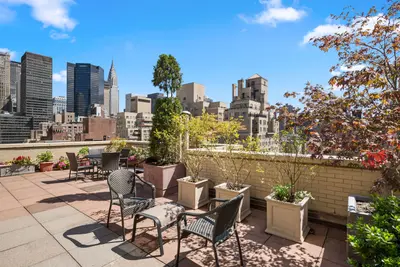
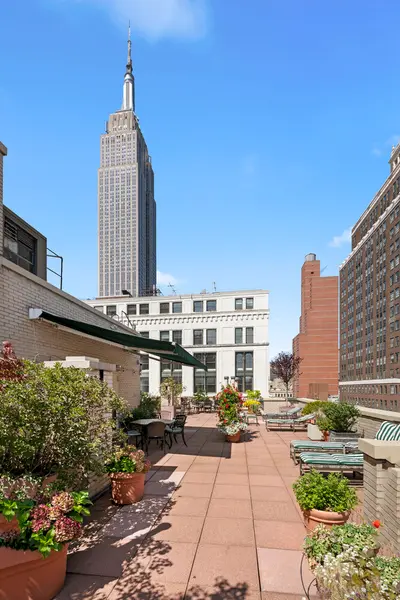
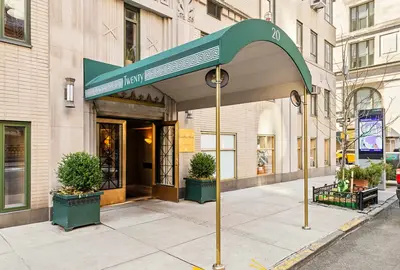
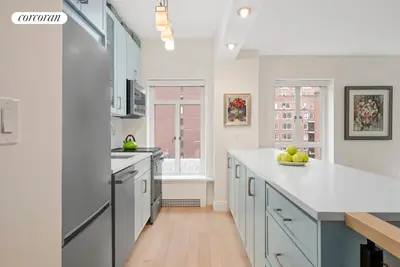
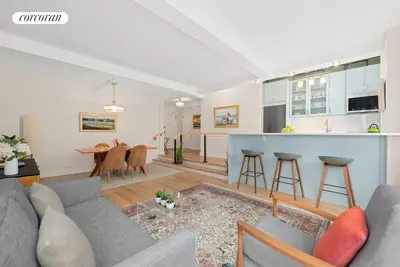
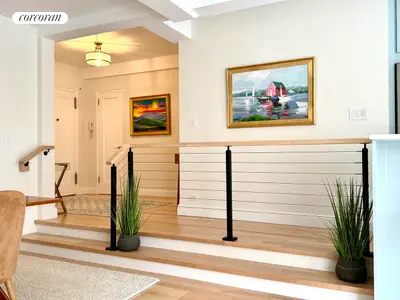
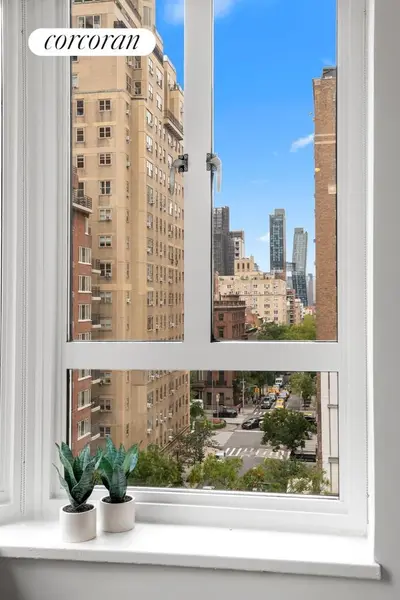
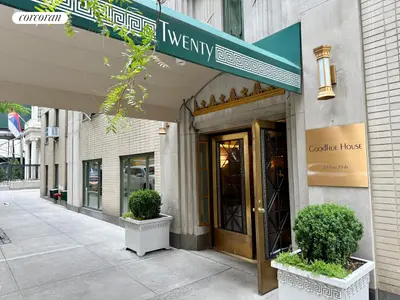
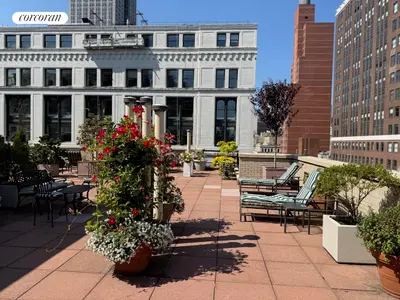
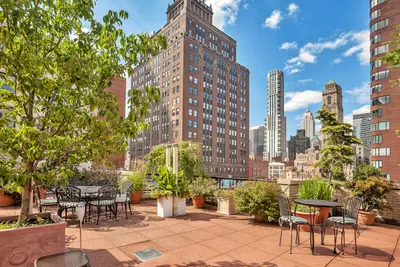
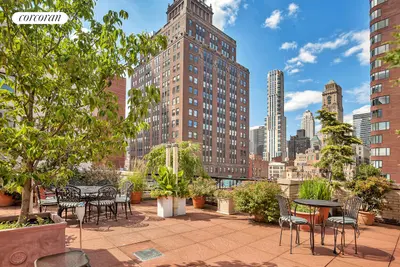
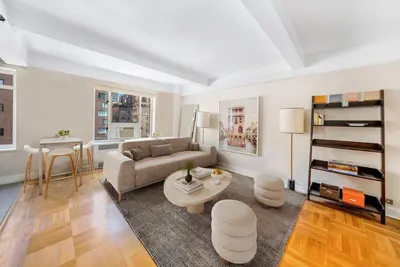
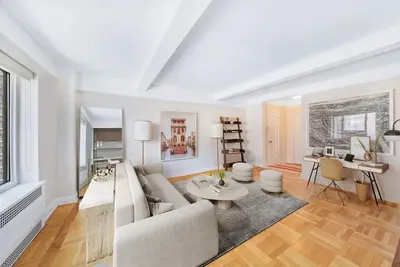
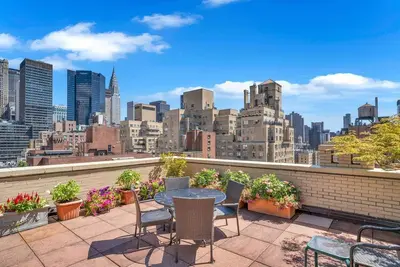

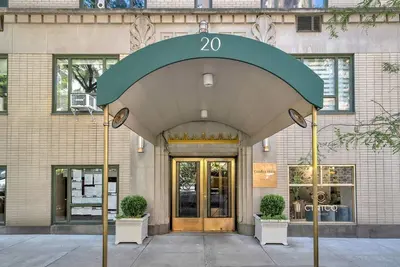
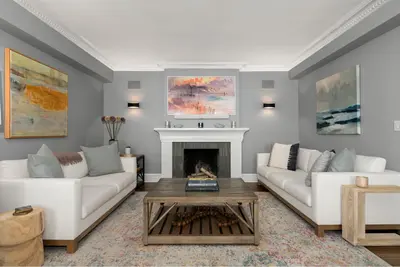
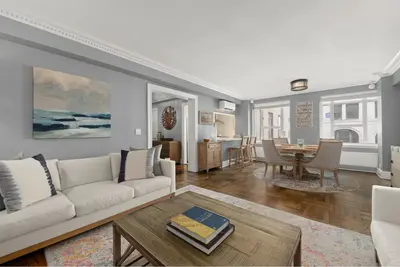
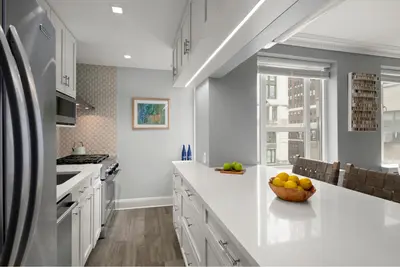
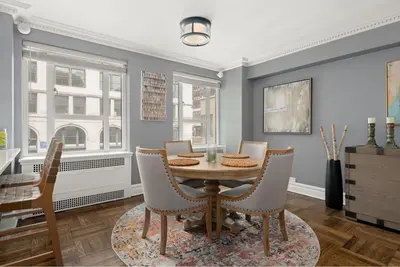
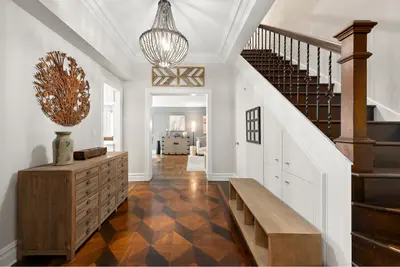
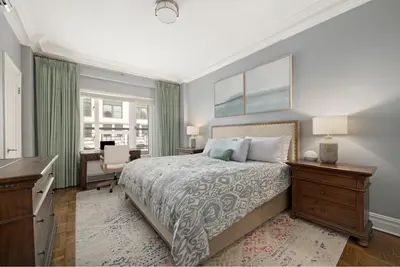
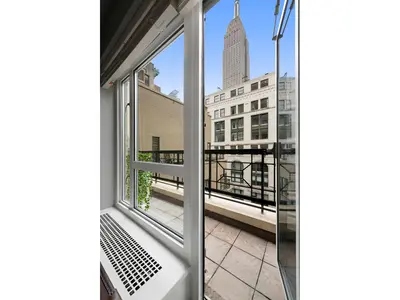
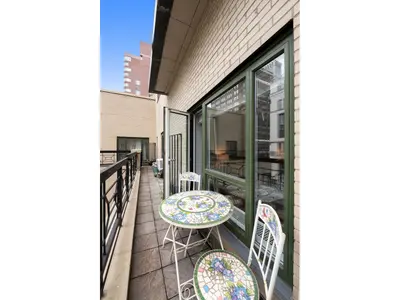
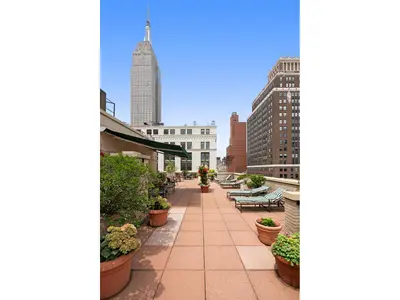
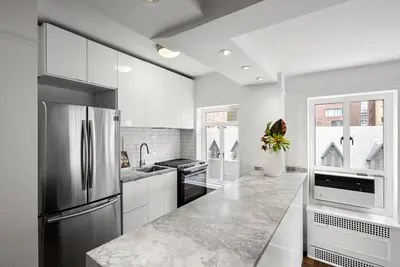
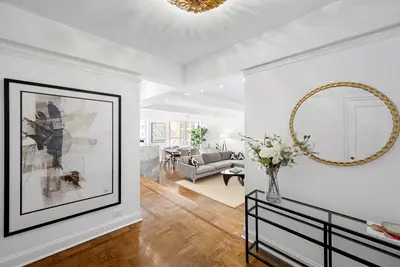
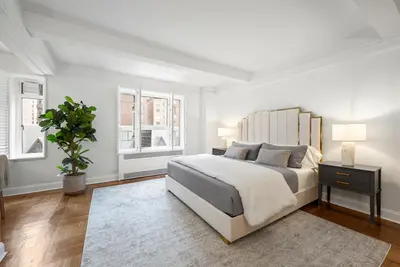
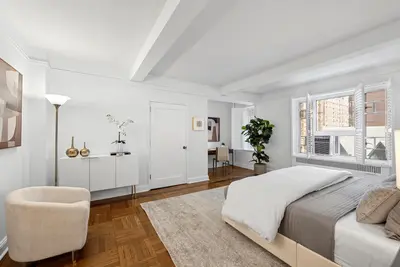
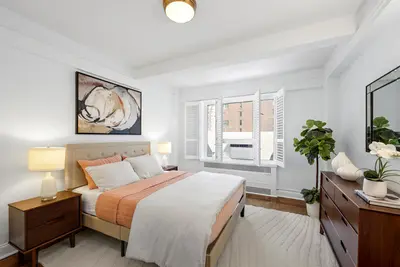
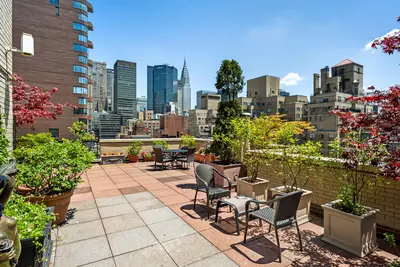
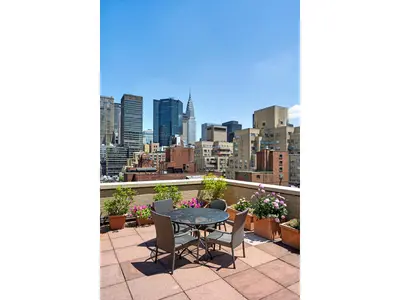
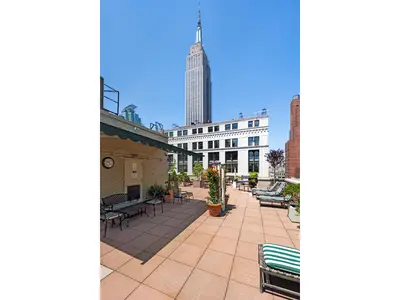
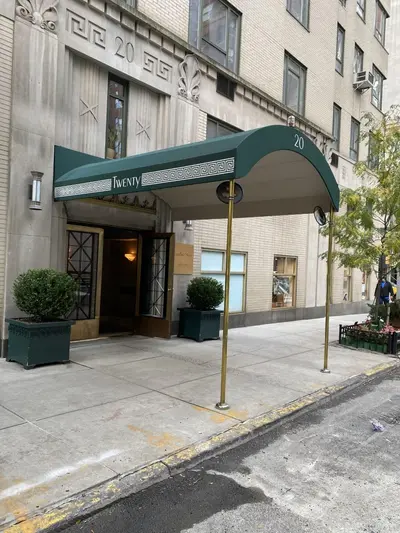
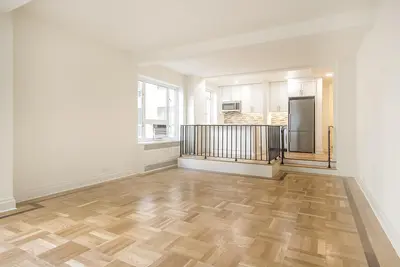
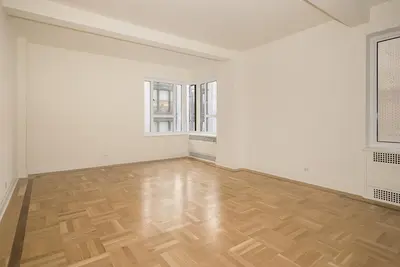
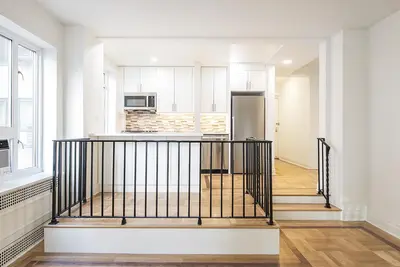
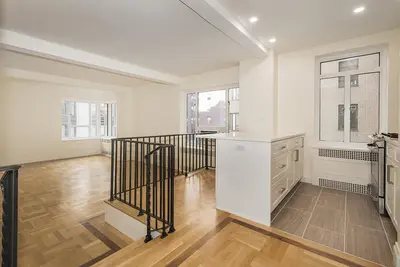


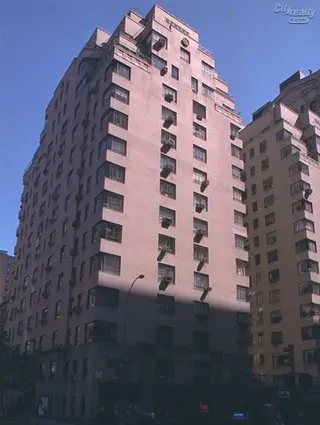
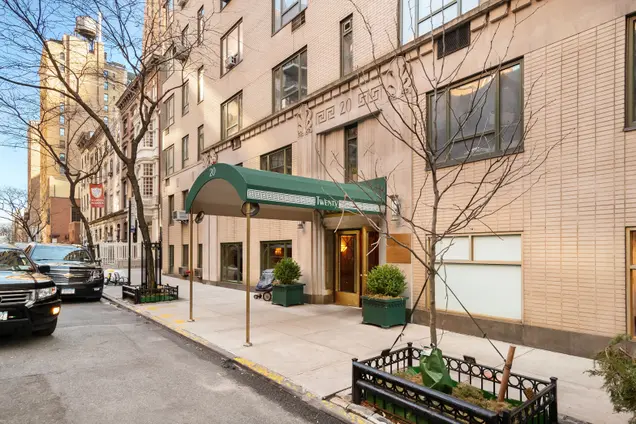
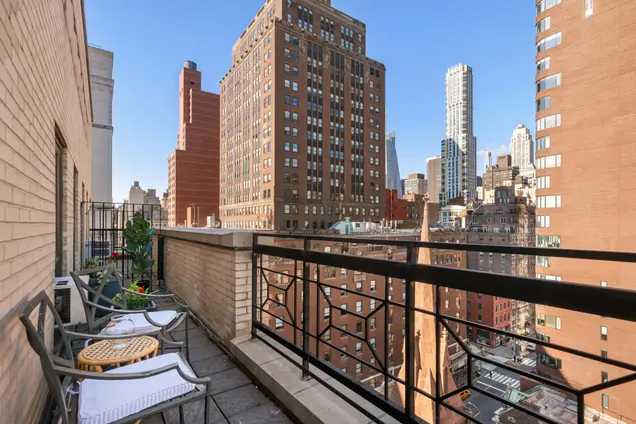
Goodhue House at 20 East 35th Street ranks among Murray Hill’s best co-ops, thanks to its broad, unobstructed corner windows, modest yet refined classicist façade ornament, recently-renovated lobby, and a spacious roof deck. Built in 1937, the brick-clad residence a block south of the Morgan Library fronts on Madison Avenue and offers 166 apartments, spectacular views of the nearby Empire State Building views. Midtown meets Gramercy at Murray Hill, where The School of Visual Arts is a neighbor, Bryant Park sits a few blocks away, and dozens of local shopping and dining spots run the gamut from Sarabeth’s to Trader Joe’s.


View school info, local attractions, transportation options & more.
Experience amazing 3D aerial maps and fly throughs.
For some co-ops, instead of price per square foot, we use an estimate of the number of rooms for each sold apartment to chart price changes over time. This is because many co-op listings do not include square footage information, and this makes it challenging to calculate accurate square-foot averages.
By displaying the price per estimated room count, we are able to provide a more reliable and consistent metric for comparing sales in the building. While we hope that this gives you a clearer sense of price trends in the building, all data should be independently verified. All data provided are only estimates and should not be used to make any purchase or sale decision.
Broker & Buyer Comments