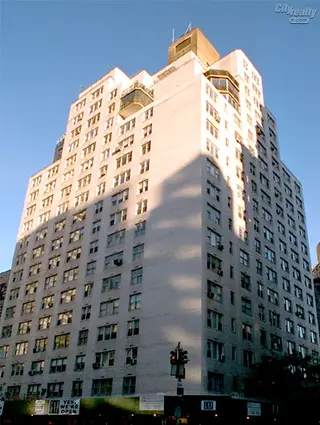
Murray Hill Terrace, 201 East 36th Street: Sales Summary
between Third Avenue & Second Avenue Building Profile
All Sales
No sales in the past 12 months
No sales in the past 12 months
No sales in the past 12 months
No sales in the past 12 months
Year
Avg Price / Ft2
Median Price / Ft2
Avg. Actual Price
Med. Actual Price
Transactions
2025
-
-
-
-
0
2024
-
-
-
-
0
2023
-
$755,000
-
$755,000
1
2022
$984
$922,214
$897
$860,000
7
2021
$856
$818,538
$877
$800,000
7
2020
$1,081
$985,000
$1,130
$1,075,000
3
2019
$1,203
$1,469,667
$1,217
$1,465,000
3
2018
$1,089
$924,714
$1,026
$840,000
7
2017
$1,096
$1,159,200
$1,092
$1,199,000
5
2016
$975
$910,460
$995
$799,000
7
2015
$1,014
$895,211
$1,029
$837,500
8
2014
$994
$932,000
$1,004
$840,000
11
2013
$936
$835,750
$908
$761,500
8
Year
Avg Price / Ft2
Median Price / Ft2
Avg. Actual Price
Med. Actual Price
Transactions
2012
$904
$768,867
$902
$778,000
3
2011
$785
$722,333
$785
$670,000
6
2010
$736
$599,167
$679
$549,000
3
2009
$951
$860,000
$951
$860,000
1
2008
$877
$662,750
$852
$678,000
4
2007
$851
$739,596
$833
$712,775
5
2006
$816
$637,861
$835
$680,000
9
2005
$861
$936,466
$830
$929,500
4
2004
$670
$649,194
$688
$648,750
16
2003
$493
$460,557
$493
$425,880
15
The Breakdown of All Sales by Apartment Size