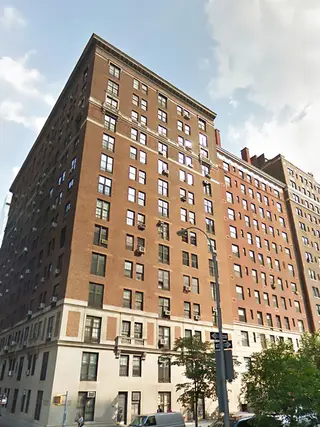
The Griffon, 77 Park Avenue: Sales Summary
between East 38th Street & East 39th Street Building Profile
All Sales
$1,342
Avg. Price / ft2
Past 12 months, based on 7 sales
$1,382,214
Avg. Price -
Past 12 months, based on 7 sales
$1,327
Median Price / ft2
Past 12 months, based on 7 sales
$1,250,000
Median Price
Past 12 months, based on 7 sales
The Breakdown of All Sales by Apartment Size
Studios
No sales in the past 12 months
No sales in the past 12 months
No sales in the past 12 months
No sales in the past 12 months
Show More
two Bedrooms
No sales in the past 12 months
No sales in the past 12 months
No sales in the past 12 months
No sales in the past 12 months
Show More
four Bedrooms
No sales in the past 12 months
No sales in the past 12 months
No sales in the past 12 months
No sales in the past 12 months
Show More
one Bedroom
$1,322
Avg. Price / ft2 -
Past 12 months, based on 6 sales
$1,209,583
Avg. Price -
Past 12 months, based on 6 sales
$1,289
Median Price / ft2 -
Past 12 months, based on 6 sales
$1,230,000
Median Price -
Past 12 months, based on 6 sales
Show More
three Bedrooms
$1,463
Avg. Price / ft2 -
Past 12 months, based on 1 sale
$2,418,000
Avg. Price -
Past 12 months, based on 1 sale
$1,463
Median Price / ft2 -
Past 12 months, based on 1 sale
$2,418,000
Median Price -
Past 12 months, based on 1 sale
Show More
five Bedrooms
No sales in the past 12 months
No sales in the past 12 months
No sales in the past 12 months
No sales in the past 12 months
Show More