The John Murray House, 220 Madison Avenue - Murray Hill
- Apartments
- Overview & Photos
- Maps
- Floorplans
- Sales Data & Comps
- Similar Buildings
- All Units


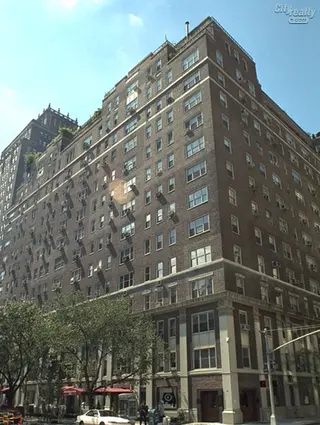
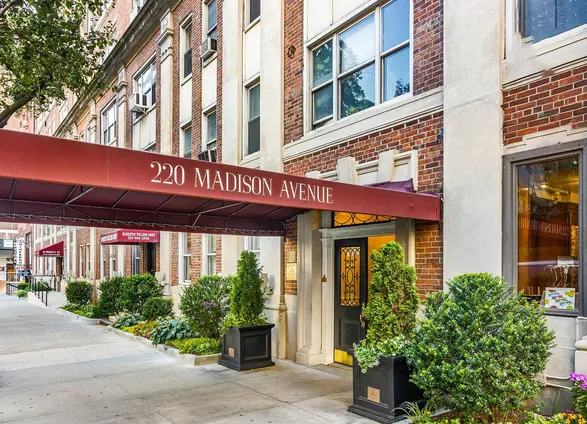
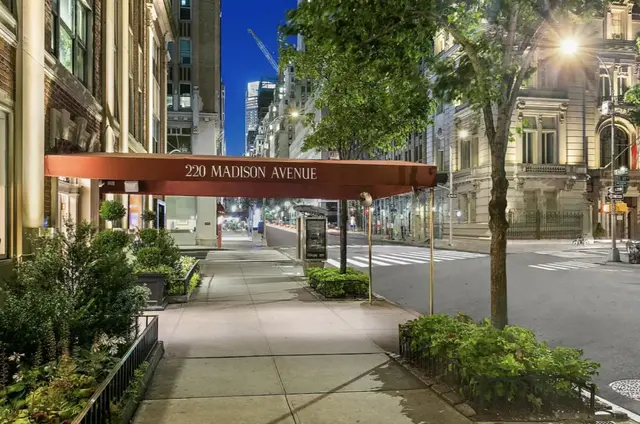
The John Murray House, an elegant pre-war cooperative building at 220 Madison Avenue, occupies the entire blockfront between 36th and 37th Streets across from the Morgan Library. Designed by renowned architect Kenneth B. Norton in 1940, the same architect behind Madison Avenue's Carlton House, this 15-story red-brick building features distinctive architectural elements including white stone pilasters on its lower three floors, four stringcourses, and several terraces.
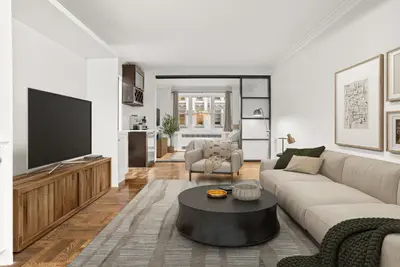
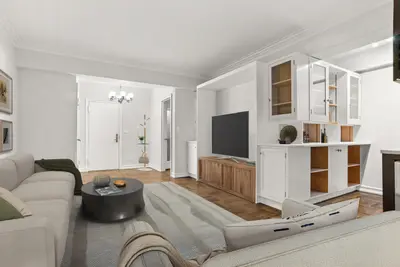
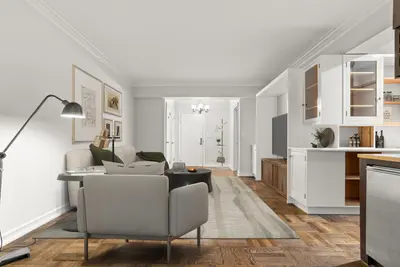
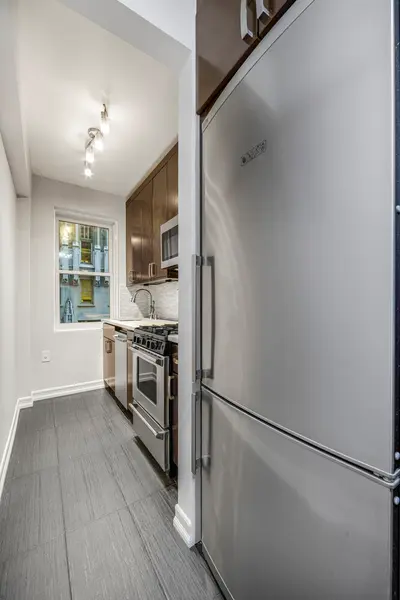
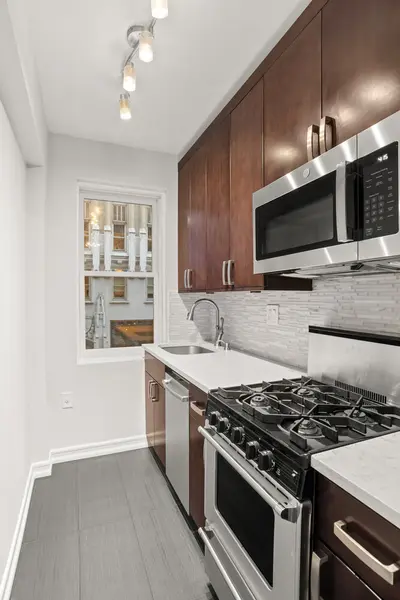
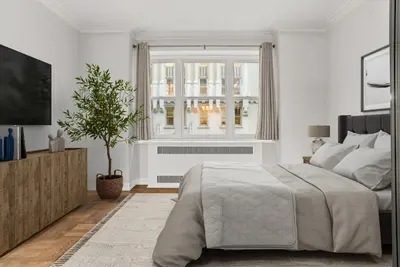
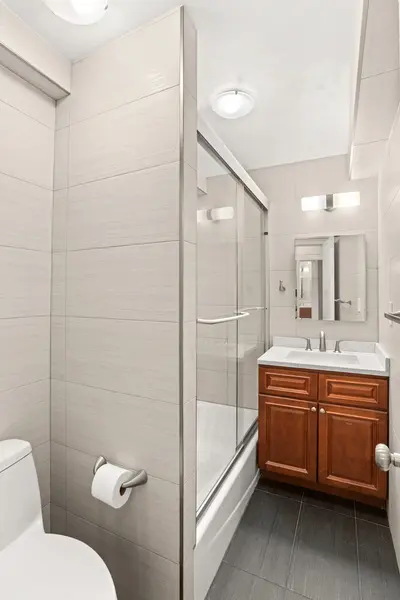
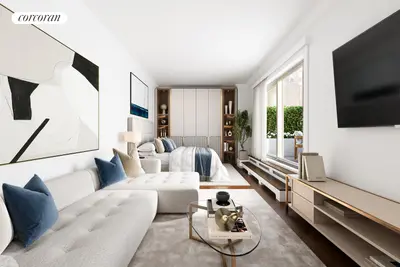
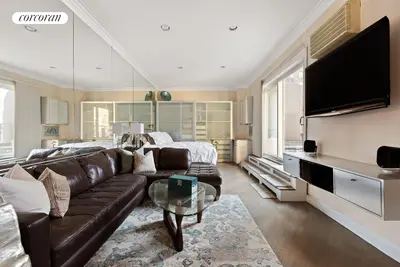
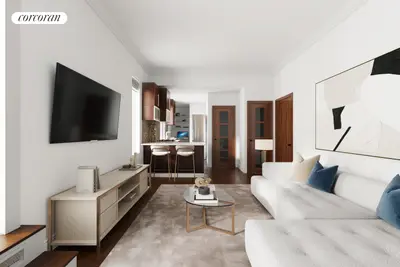
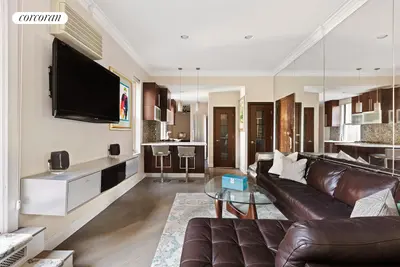
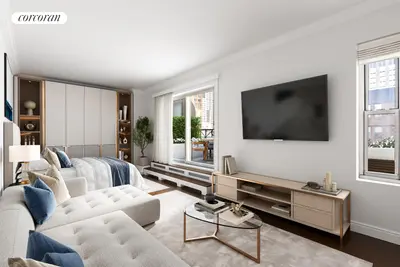
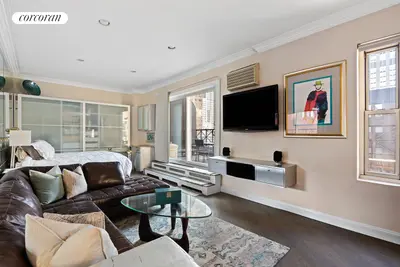
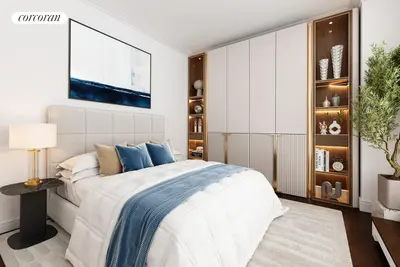
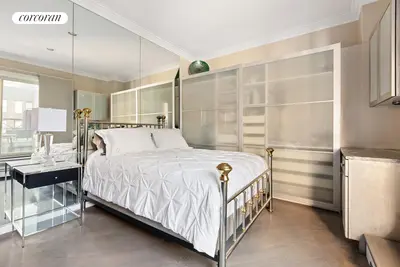
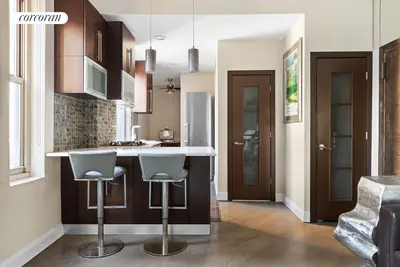
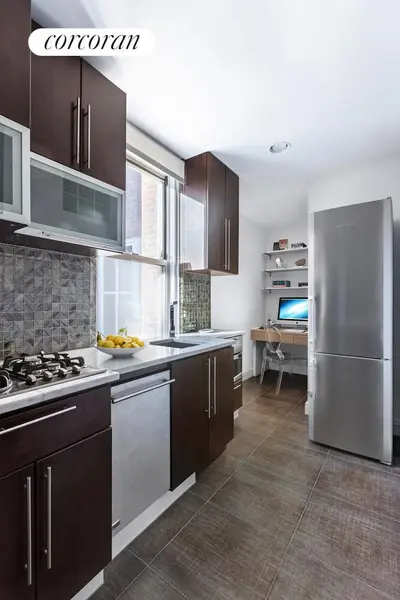
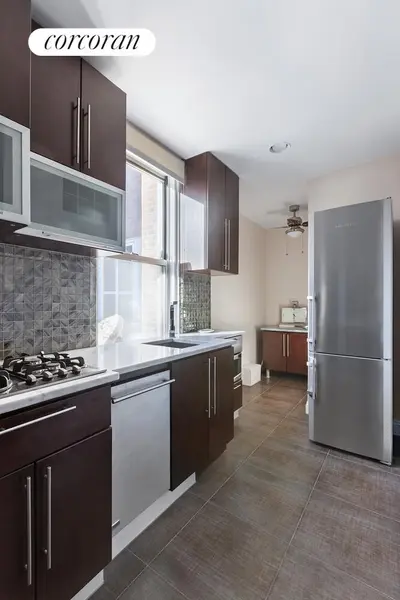
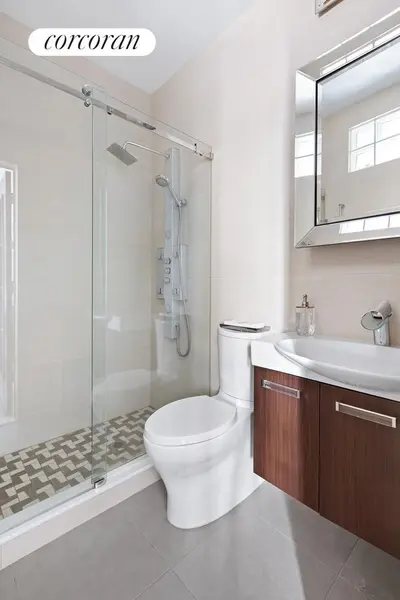
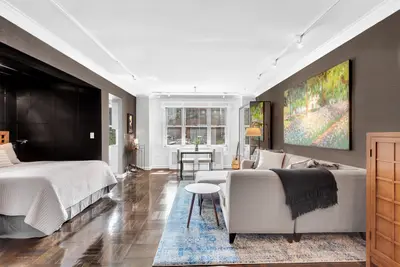
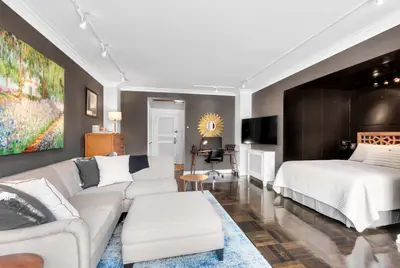
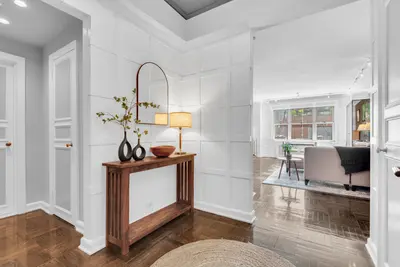
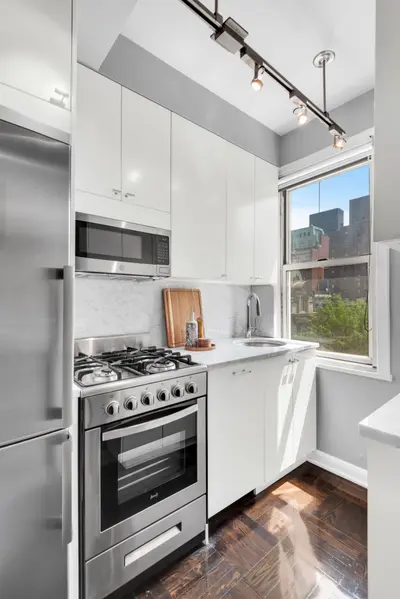
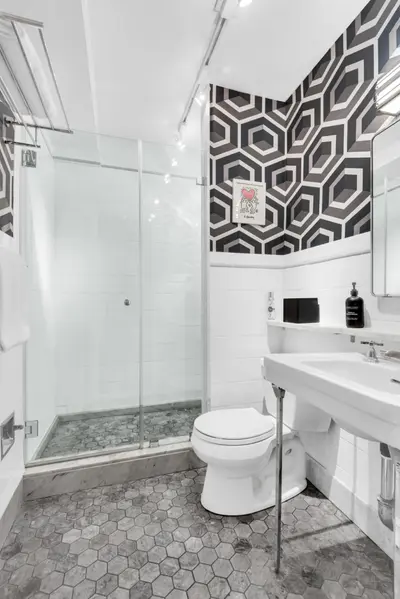
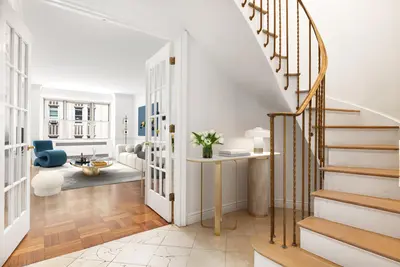
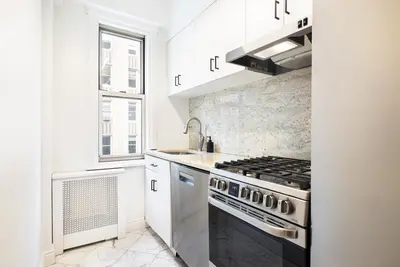
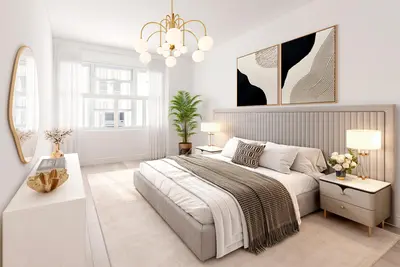
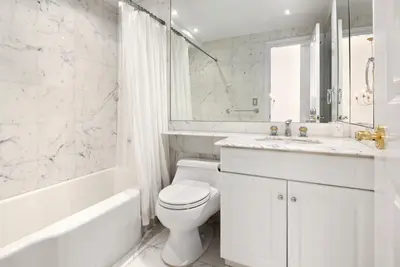
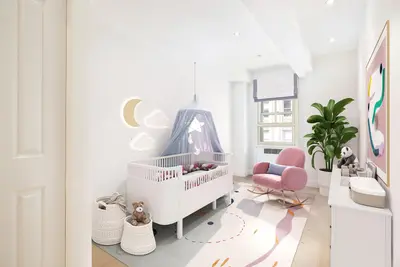
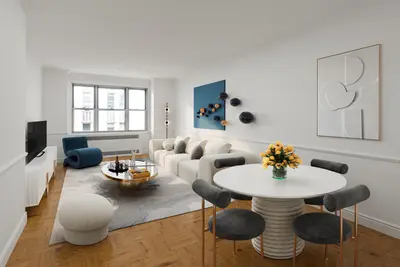
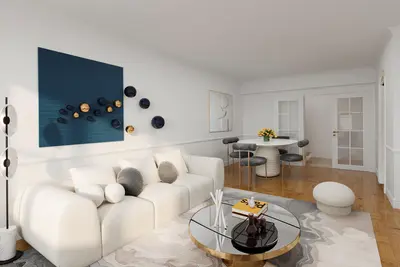
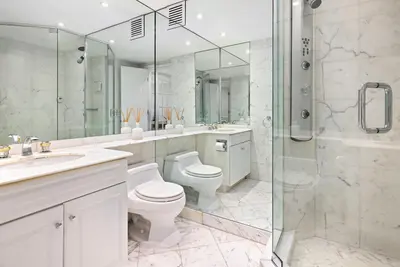
The building contains 206 residential units ranging from studios to three-bedroom apartments. Many residences feature high-beamed ceilings, hardwood floors, and multiple exposures. Some units have been thoughtfully combined or updated to include modern amenities like in-unit washer/dryers, while maintaining their pre-war character. Notable apartment features include large windows, some offering views of the historic Morgan Library and Polish Consulate.
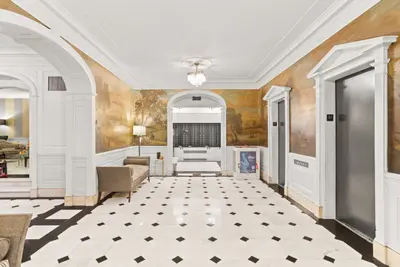
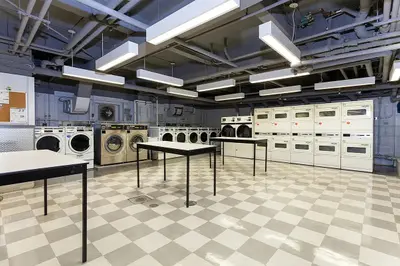
Residents enjoy comprehensive amenities including 24-hour doorman service, a live-in superintendent, and newly renovated elevators and hallways. The ground floor showcases an elegant lobby with a dedicated sitting room. The building's lower level houses laundry facilities, bicycle storage, and additional storage units available for rent. A privately operated on-site garage provides convenient parking for residents.
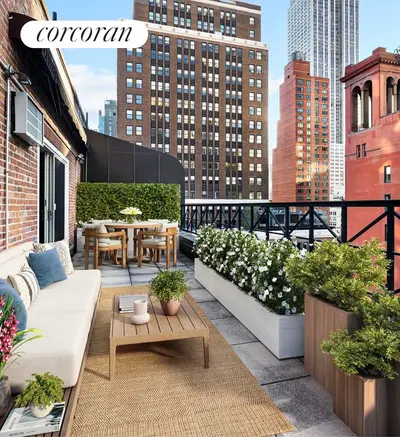
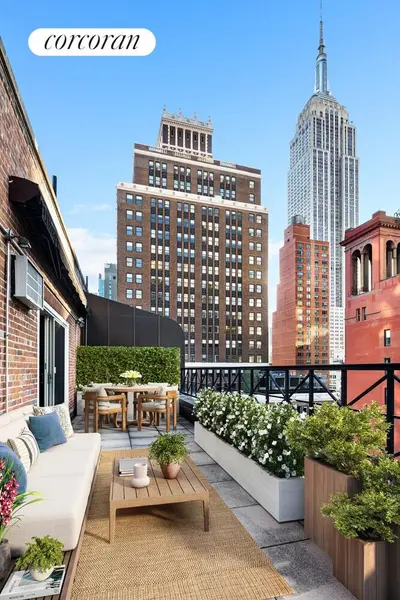
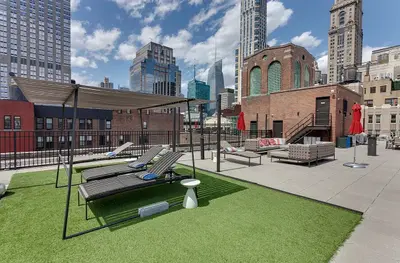
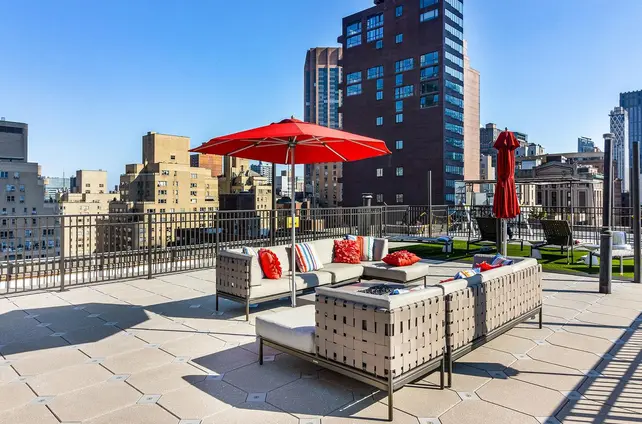
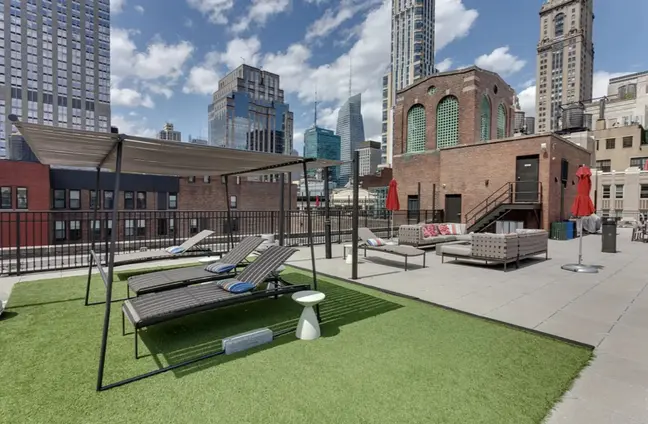
The crown jewel of the building is its beautifully landscaped roof deck, which has undergone recent renovations. The deck offers 360-degree Manhattan views, including striking vistas of the Empire State Building, and features dedicated areas for yoga, grilling, and outdoor entertaining. The space has been outfitted with new furniture and complete landscaping.
Situated in the heart of Murray Hill, the building's location provides easy access to Grand Central Terminal, Bryant Park, and numerous dining and shopping destinations including Whole Foods and Trader Joe's. The neighborhood seamlessly blends sophistication, culture, and urban convenience.
The cooperative maintains a pet-friendly policy and allows for pied-à-terre use and co-purchasing arrangements. The building's management has demonstrated ongoing commitment to maintaining and upgrading facilities, as evidenced by recent renovations to common areas and the rooftop terrace.


View school info, local attractions, transportation options & more.
Experience amazing 3D aerial maps and fly throughs.
For some co-ops, instead of price per square foot, we use an estimate of the number of rooms for each sold apartment to chart price changes over time. This is because many co-op listings do not include square footage information, and this makes it challenging to calculate accurate square-foot averages.
By displaying the price per estimated room count, we are able to provide a more reliable and consistent metric for comparing sales in the building. While we hope that this gives you a clearer sense of price trends in the building, all data should be independently verified. All data provided are only estimates and should not be used to make any purchase or sale decision.
Broker & Buyer Comments