116 East 63rd Street - Upper East Side
- Apartments
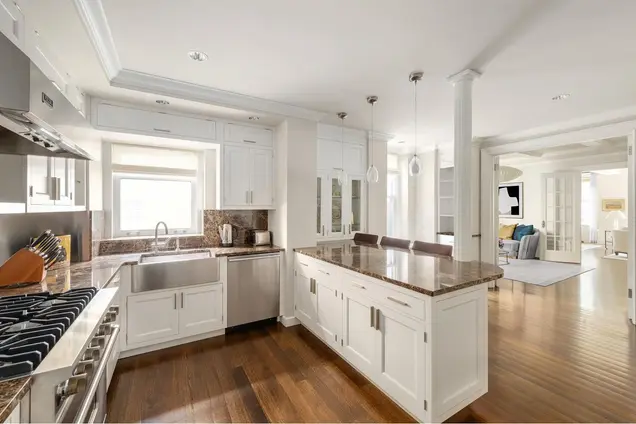
- Overview & Photos
- Maps
- Floorplans
- Sales Data & Comps
- Similar Buildings
- All Units
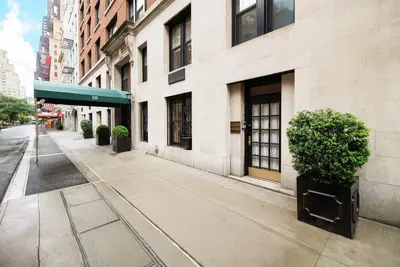
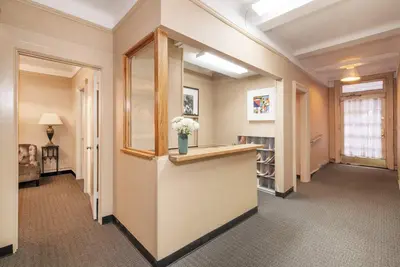
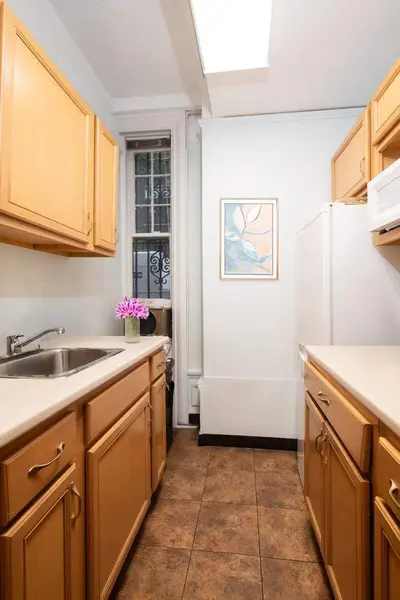
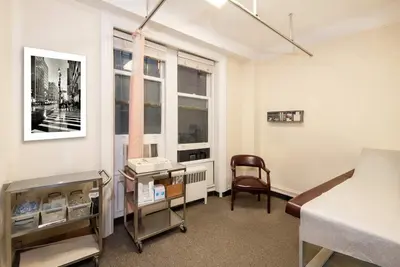
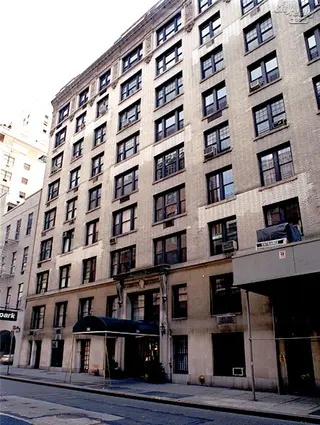
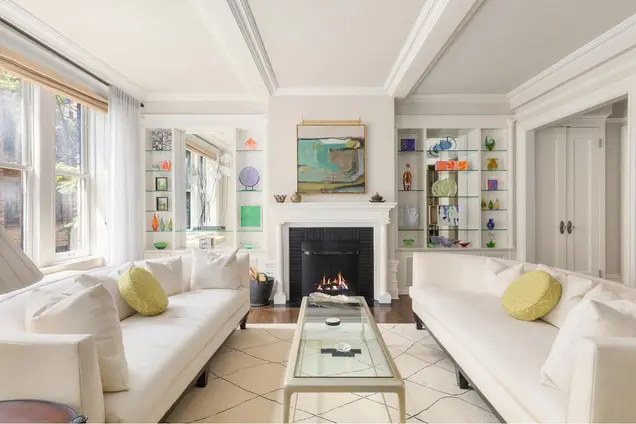
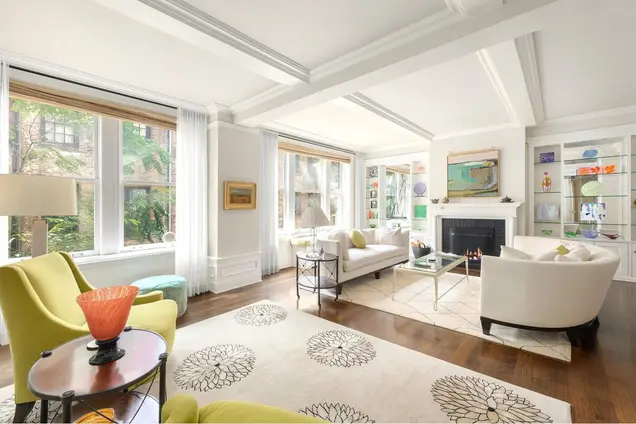
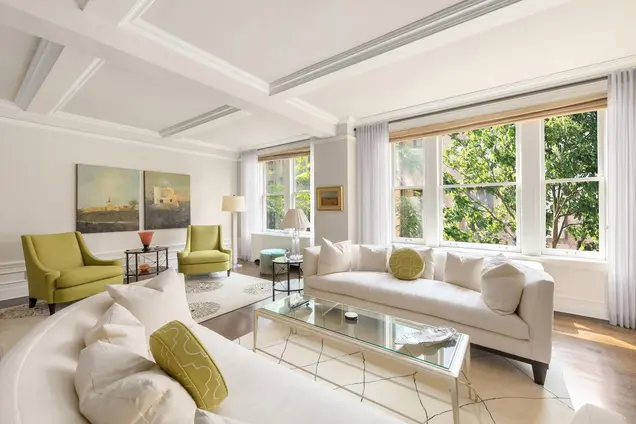
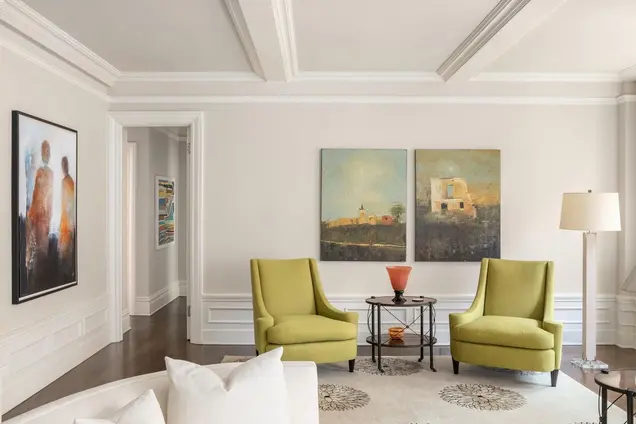
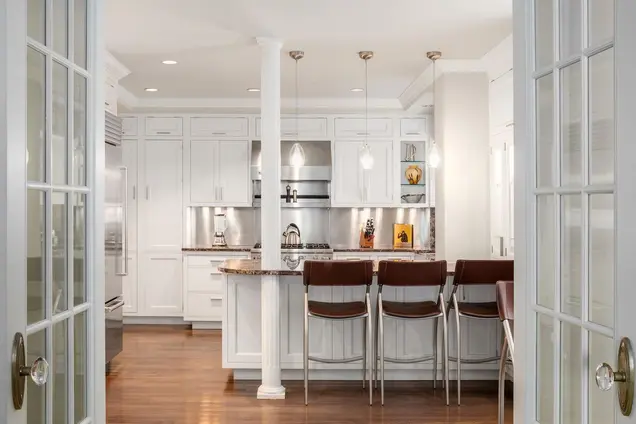
116 East 63rd Street is a pre-war co-op building in the Upper East Side's Park/Fifth Ave. to 79th St. neighborhood finished in 1914 and converted in 1948. The building was constructed for privacy with only two units per floor, and the tenth floor houses staff rooms for rent. The building offers a central laundry room, private storage bins, bike room, and roof garden. It is next door to a parking garage and close to the F and Q trains. Pets and pied-a-terres are allowed.

View school info, local attractions, transportation options & more.
Experience amazing 3D aerial maps and fly throughs.
For some co-ops, instead of price per square foot, we use an estimate of the number of rooms for each sold apartment to chart price changes over time. This is because many co-op listings do not include square footage information, and this makes it challenging to calculate accurate square-foot averages.
By displaying the price per estimated room count, we are able to provide a more reliable and consistent metric for comparing sales in the building. While we hope that this gives you a clearer sense of price trends in the building, all data should be independently verified. All data provided are only estimates and should not be used to make any purchase or sale decision.