29 East 64th Street - Upper East Side
- Apartments
- Overview & Photos
- Maps
- Floorplans
- Sales Data & Comps
- Similar Buildings
- All Units


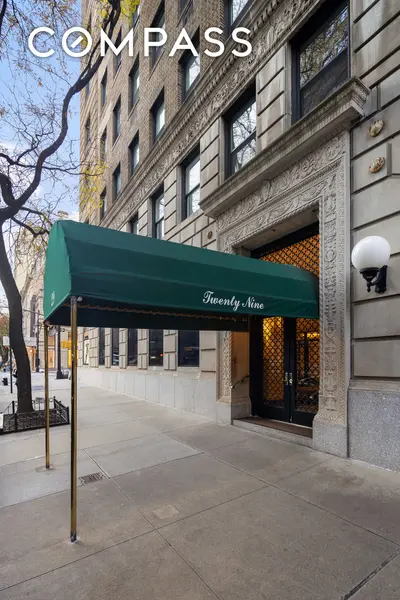


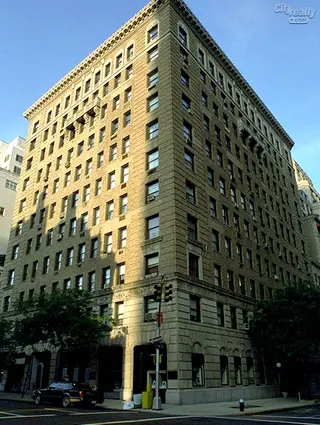
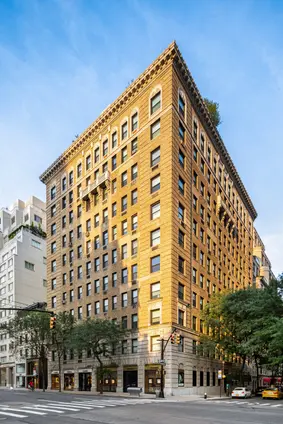
29 East 64th Street is a 12 story landmarked co-op built in 1922 by renowned architect George Frederick Pelham. This white glove building houses 41 units and occupies a prime Upper East Side location on Madison Avenue between Fifth and Park Avenues, just one block from Central Park. The building notably houses the Madison Avenue Chanel store at street level, positioning residents among some of the city's most exclusive shopping and dining.
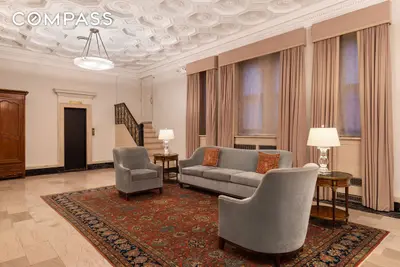
The building offers full service amenities including a 24 hour doorman, live-in resident manager, and a recently renovated lobby with soaring ceilings. Additional amenities include basement storage with private bins, a bike room, and laundry facilities. The building permits pets with board approval, pieds-à-terre, and up to 40% financing, though buyers pay a 2% flip tax.
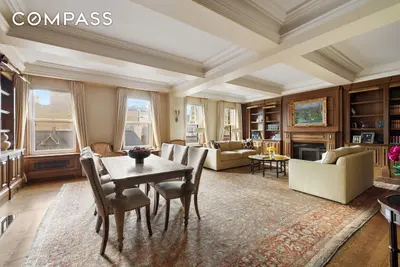
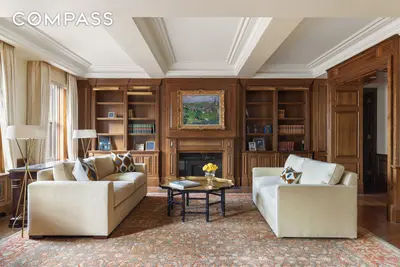
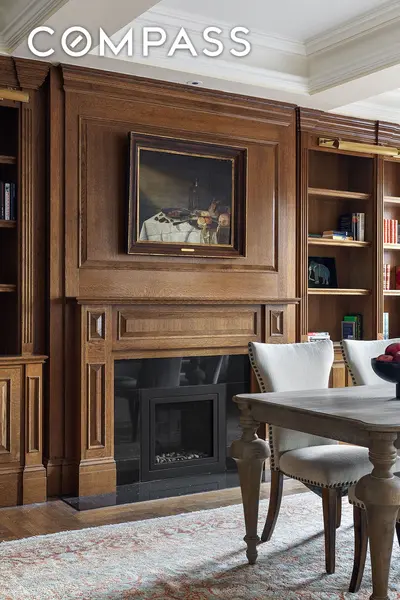
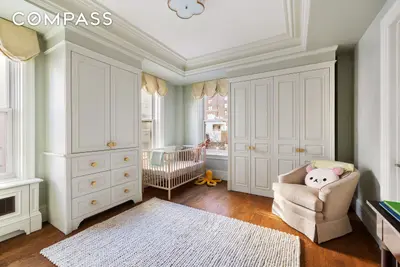
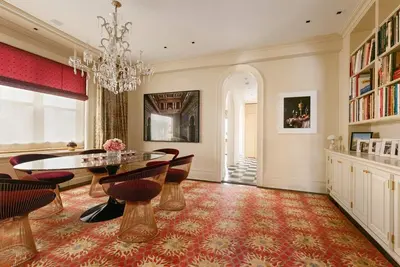
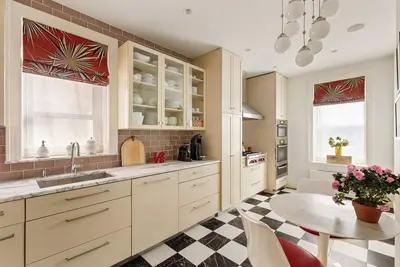
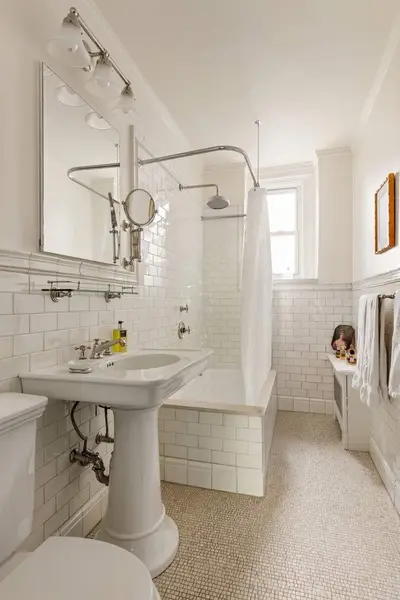
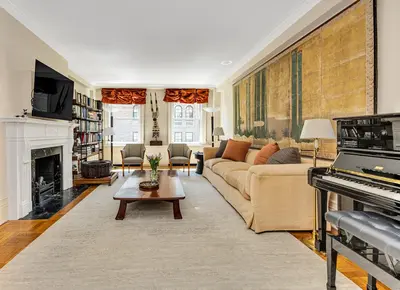
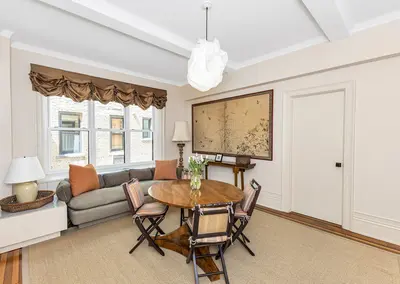
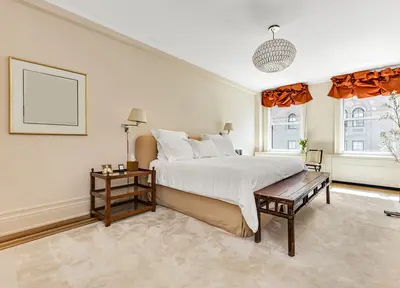
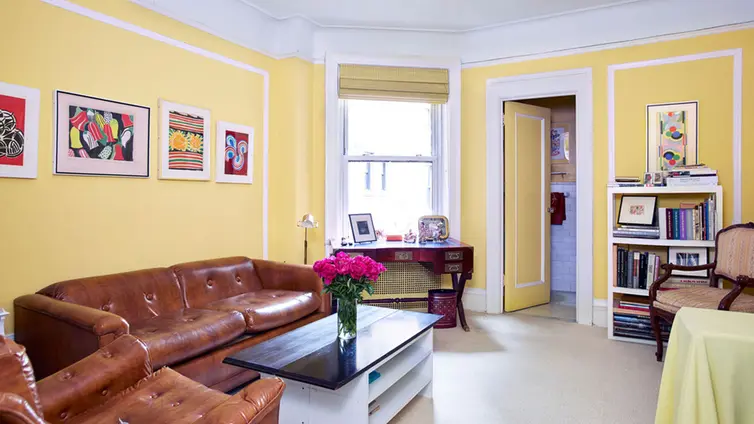
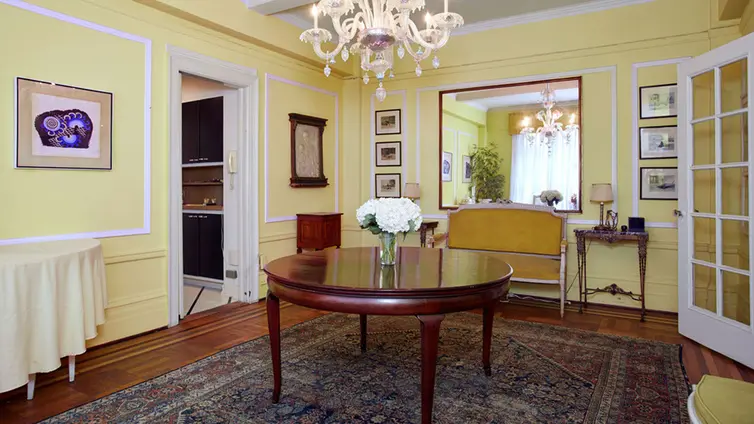
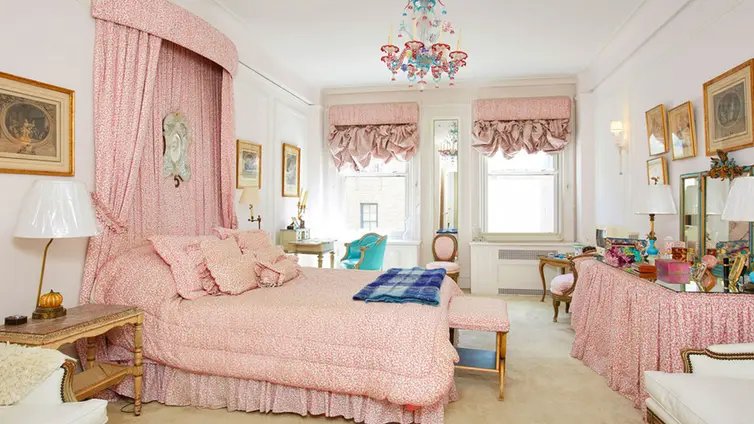
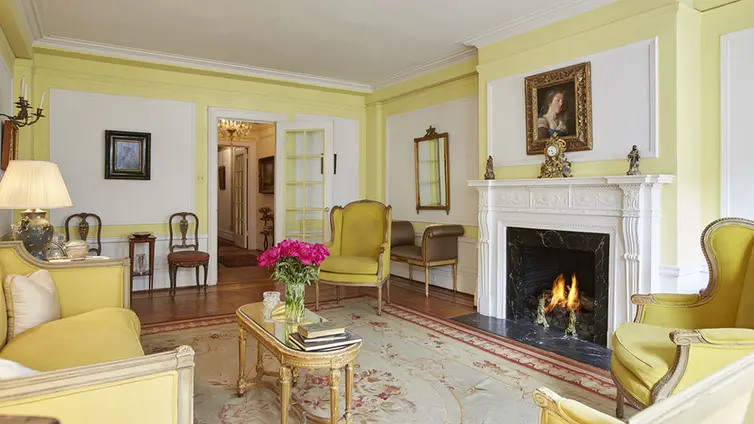
Apartments typically feature classic six layouts with semi-private elevator landings serving just two units per floor. Most residences showcase traditional prewar details including high ceilings (around 9'5"), decorative fireplaces, crown moldings, and beautifully restored hardwood floors. South facing exposures are common for living rooms and master bedrooms, providing excellent light and views toward the distinguished architecture along tree-lined 64th Street.
The building's location provides immediate access to Madison Avenue's luxury boutiques and renowned restaurants like Daniel and Polo Bar, while Central Park, major museums, and transportation options remain within easy walking distance. This combination of architectural pedigree, prime location, and white glove service has established the building as one of the most sought after addresses in the prestigious Lennox Hill neighborhood.


View school info, local attractions, transportation options & more.
Experience amazing 3D aerial maps and fly throughs.
For some co-ops, instead of price per square foot, we use an estimate of the number of rooms for each sold apartment to chart price changes over time. This is because many co-op listings do not include square footage information, and this makes it challenging to calculate accurate square-foot averages.
By displaying the price per estimated room count, we are able to provide a more reliable and consistent metric for comparing sales in the building. While we hope that this gives you a clearer sense of price trends in the building, all data should be independently verified. All data provided are only estimates and should not be used to make any purchase or sale decision.


