The Belvoir, 470 West End Avenue - Upper West Side
- Apartments
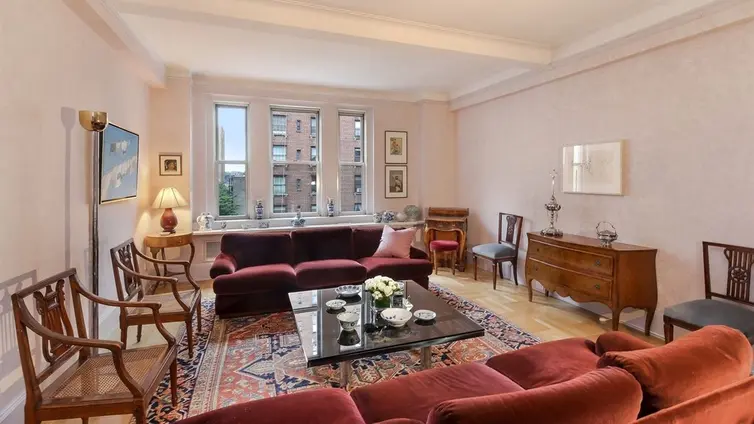
- Overview & Photos
- Maps
- Floorplans
- Sales Data & Comps
- Similar Buildings
- All Units
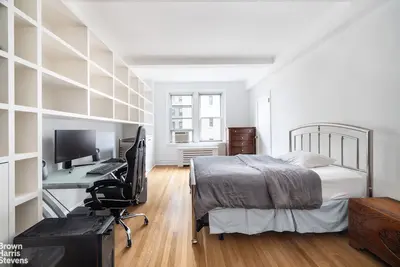
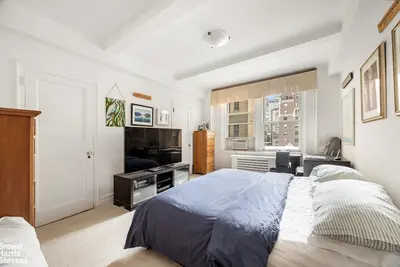
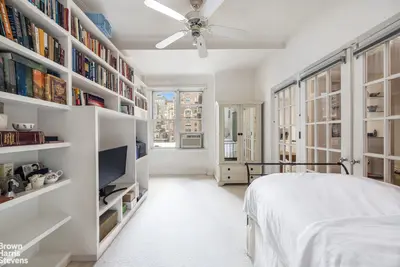
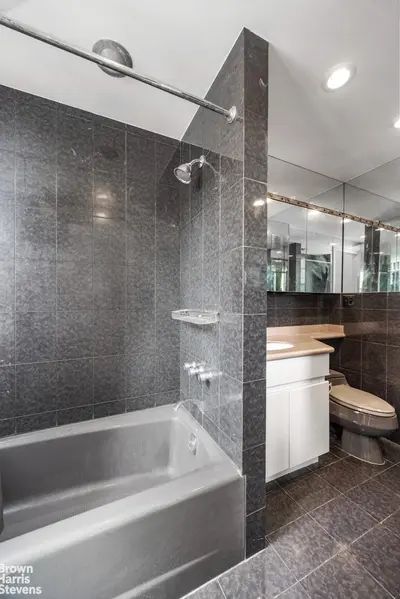
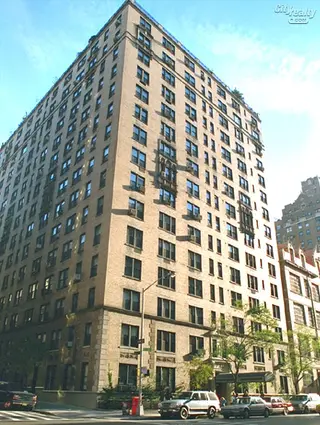
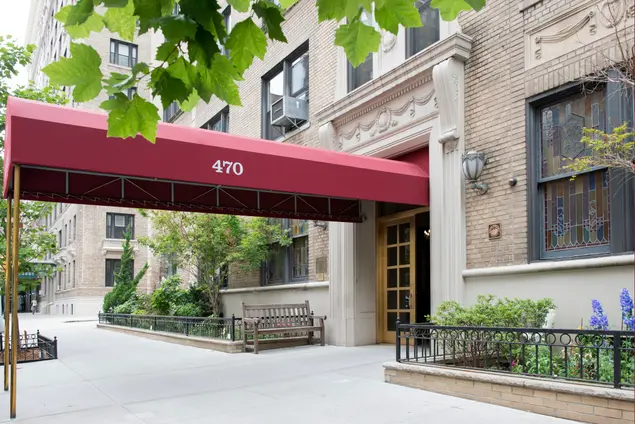
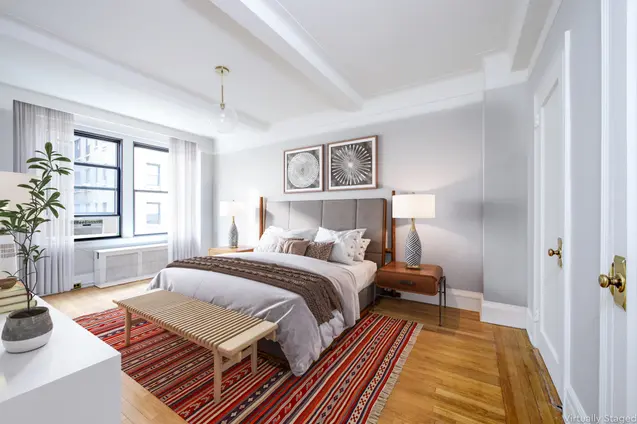
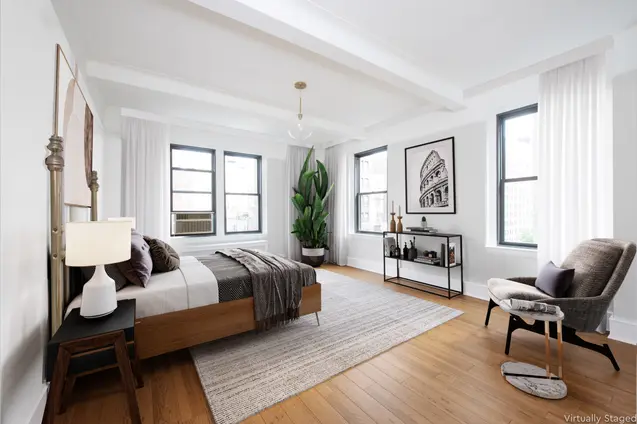
The Belvoir is a handsome 16-story brick cooperative designed by Emery Roth, finished in 1928, and standing at the corner of West 83rd Street and West End Avenue. The stately prewar building is distinguished by its Italian Renaissance palazzo-style façade, bronze entrance doors, bronze-etched elevator doors, original stained glass windows and vaulted ceilings in the entrance, and a grand lobby clad in marble.
Pets are permitted, and amenities include a full-time doorman, live-in super, two elevator banks with passenger and service elevators, central laundry room, bike room, and separate storage bins for each apartment. Its address in the heart of the Upper West Side puts it near every convenience, from shopping and restaurants to gourmet grocers, subways and cross-town buses as well as Broadway, Riverside Park, and the Hudson River Greenway.


View school info, local attractions, transportation options & more.
Experience amazing 3D aerial maps and fly throughs.
For some co-ops, instead of price per square foot, we use an estimate of the number of rooms for each sold apartment to chart price changes over time. This is because many co-op listings do not include square footage information, and this makes it challenging to calculate accurate square-foot averages.
By displaying the price per estimated room count, we are able to provide a more reliable and consistent metric for comparing sales in the building. While we hope that this gives you a clearer sense of price trends in the building, all data should be independently verified. All data provided are only estimates and should not be used to make any purchase or sale decision.