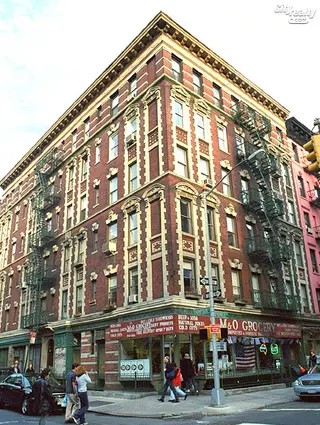
124 Thompson Street: Price Comparison
between Prince Street & West Houston Street Building Profile
124 Thompson Street
N/A
Avg. Price
Past 12 months
Past 12 months
2024
$990,290
2023
-
2022
$1,200,000
2021
-
2020
$880,000
2019
-
2018
$946,667
2017
$597,000
2016
$897,000
2015
$658,750
2014
$514,250
2013
$745,000
2012
$685,000
2011
$541,000
2010
-
2009
-
2008
-
2007
$787,500
2006
$477,000
2005
$638,118
2004
$681,000
2003
$362,250
124 Thompson Street
N/A
Median Price
Past 12 months
Past 12 months
2024
$990,290
2023
-
2022
$1,200,000
2021
-
2020
$880,000
2019
-
2018
$900,000
2017
$597,000
2016
$897,000
2015
$658,750
2014
$523,500
2013
$745,000
2012
$685,000
2011
$541,000
2010
-
2009
-
2008
-
2007
$787,500
2006
$477,000
2005
$629,735
2004
$681,000
2003
$364,500
124 Thompson Street
N/A
Avg. Price
Past 12 months
Past 12 months
2024
-
2023
-
2022
-
2021
-
2020
-
2019
-
2018
$900,000
2017
$459,000
2016
-
2015
$537,500
2014
-
2013
-
2012
-
2011
$302,000
2010
-
2009
-
2008
-
2007
$635,000
2006
-
2005
$575,000
2004
-
2003
$370,000
124 Thompson Street
N/A
Median Price
Past 12 months
Past 12 months
2024
-
2023
-
2022
-
2021
-
2020
-
2019
-
2018
$900,000
2017
$459,000
2016
-
2015
$537,500
2014
-
2013
-
2012
-
2011
$302,000
2010
-
2009
-
2008
-
2007
$635,000
2006
-
2005
$575,000
2004
-
2003
$370,000
124 Thompson Street
N/A
Avg. Price
Past 12 months
Past 12 months
2024
$515,000
2023
-
2022
$1,200,000
2021
-
2020
$880,000
2019
-
2018
$690,000
2017
-
2016
$897,000
2015
$780,000
2014
$552,333
2013
$745,000
2012
$685,000
2011
$780,000
2010
-
2009
-
2008
-
2007
-
2006
$477,000
2005
$659,157
2004
$681,000
2003
$359,667
124 Thompson Street
N/A
Median Price
Past 12 months
Past 12 months
2024
$515,000
2023
-
2022
$1,200,000
2021
-
2020
$880,000
2019
-
2018
$690,000
2017
-
2016
$897,000
2015
$780,000
2014
$599,000
2013
$745,000
2012
$685,000
2011
$780,000
2010
-
2009
-
2008
-
2007
-
2006
$477,000
2005
$668,470
2004
$681,000
2003
$360,000
124 Thompson Street
N/A
Avg. Price
Past 12 months
Past 12 months
2024
$1,465,580
2023
-
2022
-
2021
-
2020
-
2019
-
2018
$1,250,000
2017
$735,000
2016
-
2015
-
2014
-
2013
-
2012
-
2011
-
2010
-
2009
-
2008
-
2007
$940,000
2006
-
2005
-
2004
-
2003
-
124 Thompson Street
N/A
Median Price
Past 12 months
Past 12 months
2024
$1,465,580
2023
-
2022
-
2021
-
2020
-
2019
-
2018
$1,250,000
2017
$735,000
2016
-
2015
-
2014
-
2013
-
2012
-
2011
-
2010
-
2009
-
2008
-
2007
$940,000
2006
-
2005
-
2004
-
2003
-
124 Thompson Street
N/A
Avg. Price
Past 12 months
Past 12 months
2024
-
2023
-
2022
-
2021
-
2020
-
2019
-
2018
-
2017
-
2016
-
2015
-
2014
-
2013
-
2012
-
2011
-
2010
-
2009
-
2008
-
2007
-
2006
-
2005
-
2004
-
2003
-
124 Thompson Street
N/A
Median Price
Past 12 months
Past 12 months
2024
-
2023
-
2022
-
2021
-
2020
-
2019
-
2018
-
2017
-
2016
-
2015
-
2014
-
2013
-
2012
-
2011
-
2010
-
2009
-
2008
-
2007
-
2006
-
2005
-
2004
-
2003
-
124 Thompson Street
N/A
Avg. Price
Past 12 months
Past 12 months
2024
-
2023
-
2022
-
2021
-
2020
-
2019
-
2018
-
2017
-
2016
-
2015
-
2014
-
2013
-
2012
-
2011
-
2010
-
2009
-
2008
-
2007
-
2006
-
2005
-
2004
-
2003
-
124 Thompson Street
N/A
Median Price
Past 12 months
Past 12 months
2024
-
2023
-
2022
-
2021
-
2020
-
2019
-
2018
-
2017
-
2016
-
2015
-
2014
-
2013
-
2012
-
2011
-
2010
-
2009
-
2008
-
2007
-
2006
-
2005
-
2004
-
2003
-

 6sqft delivers the latest on real estate, architecture, and design, straight from New York City.
