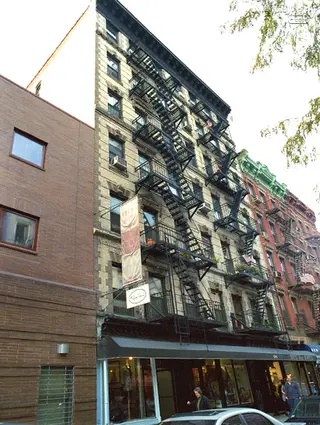
131 Thompson Street: Price Comparison
between Prince Street & West Houston Street Building Profile
131 Thompson Street
N/A
Avg. Price
Past 12 months
Past 12 months
2024
$949,500
2023
$1,020,000
2022
-
2021
-
2020
$725,000
2019
-
2018
$915,000
2017
$1,438,750
2016
-
2015
-
2014
$727,000
2013
$785,000
2012
-
2011
-
2010
$610,000
2009
-
2008
$705,000
2007
$612,500
2006
-
2005
$700,686
2004
$458,055
2003
$345,046
131 Thompson Street
N/A
Median Price
Past 12 months
Past 12 months
2024
$949,500
2023
$1,020,000
2022
-
2021
-
2020
$725,000
2019
-
2018
$915,000
2017
$797,500
2016
-
2015
-
2014
$727,000
2013
$785,000
2012
-
2011
-
2010
$610,000
2009
-
2008
$705,000
2007
$612,500
2006
-
2005
$622,871
2004
$453,489
2003
$345,046
131 Thompson Street
N/A
Avg. Price
Past 12 months
Past 12 months
2024
-
2023
-
2022
-
2021
-
2020
-
2019
-
2018
-
2017
-
2016
-
2015
-
2014
-
2013
-
2012
-
2011
-
2010
-
2009
-
2008
-
2007
-
2006
-
2005
-
2004
-
2003
-
131 Thompson Street
N/A
Median Price
Past 12 months
Past 12 months
2024
-
2023
-
2022
-
2021
-
2020
-
2019
-
2018
-
2017
-
2016
-
2015
-
2014
-
2013
-
2012
-
2011
-
2010
-
2009
-
2008
-
2007
-
2006
-
2005
-
2004
-
2003
-
131 Thompson Street
N/A
Avg. Price
Past 12 months
Past 12 months
2024
-
2023
-
2022
-
2021
-
2020
$725,000
2019
-
2018
-
2017
$661,500
2016
-
2015
-
2014
$665,000
2013
-
2012
-
2011
-
2010
$530,000
2009
-
2008
-
2007
-
2006
-
2005
-
2004
-
2003
-
131 Thompson Street
N/A
Median Price
Past 12 months
Past 12 months
2024
-
2023
-
2022
-
2021
-
2020
$725,000
2019
-
2018
-
2017
$661,500
2016
-
2015
-
2014
$665,000
2013
-
2012
-
2011
-
2010
$530,000
2009
-
2008
-
2007
-
2006
-
2005
-
2004
-
2003
-
131 Thompson Street
N/A
Avg. Price
Past 12 months
Past 12 months
2024
$949,500
2023
$1,020,000
2022
-
2021
-
2020
-
2019
-
2018
$915,000
2017
$932,000
2016
-
2015
-
2014
$789,000
2013
$785,000
2012
-
2011
-
2010
$690,000
2009
-
2008
$705,000
2007
-
2006
-
2005
$565,742
2004
$488,311
2003
$345,046
131 Thompson Street
N/A
Median Price
Past 12 months
Past 12 months
2024
$949,500
2023
$1,020,000
2022
-
2021
-
2020
-
2019
-
2018
$915,000
2017
$932,000
2016
-
2015
-
2014
$789,000
2013
$785,000
2012
-
2011
-
2010
$690,000
2009
-
2008
$705,000
2007
-
2006
-
2005
$565,742
2004
$529,504
2003
$345,046
131 Thompson Street
N/A
Avg. Price
Past 12 months
Past 12 months
2024
-
2023
-
2022
-
2021
-
2020
-
2019
-
2018
-
2017
-
2016
-
2015
-
2014
-
2013
-
2012
-
2011
-
2010
-
2009
-
2008
-
2007
-
2006
-
2005
-
2004
-
2003
-
131 Thompson Street
N/A
Median Price
Past 12 months
Past 12 months
2024
-
2023
-
2022
-
2021
-
2020
-
2019
-
2018
-
2017
-
2016
-
2015
-
2014
-
2013
-
2012
-
2011
-
2010
-
2009
-
2008
-
2007
-
2006
-
2005
-
2004
-
2003
-
131 Thompson Street
N/A
Avg. Price
Past 12 months
Past 12 months
2024
-
2023
-
2022
-
2021
-
2020
-
2019
-
2018
-
2017
$3,500,000
2016
-
2015
-
2014
-
2013
-
2012
-
2011
-
2010
-
2009
-
2008
-
2007
-
2006
-
2005
-
2004
-
2003
-
131 Thompson Street
N/A
Median Price
Past 12 months
Past 12 months
2024
-
2023
-
2022
-
2021
-
2020
-
2019
-
2018
-
2017
$3,500,000
2016
-
2015
-
2014
-
2013
-
2012
-
2011
-
2010
-
2009
-
2008
-
2007
-
2006
-
2005
-
2004
-
2003
-
131 Thompson Street
N/A
Avg. Price
Past 12 months
Past 12 months
2024
-
2023
-
2022
-
2021
-
2020
-
2019
-
2018
-
2017
-
2016
-
2015
-
2014
-
2013
-
2012
-
2011
-
2010
-
2009
-
2008
-
2007
-
2006
-
2005
-
2004
-
2003
-
131 Thompson Street
N/A
Median Price
Past 12 months
Past 12 months
2024
-
2023
-
2022
-
2021
-
2020
-
2019
-
2018
-
2017
-
2016
-
2015
-
2014
-
2013
-
2012
-
2011
-
2010
-
2009
-
2008
-
2007
-
2006
-
2005
-
2004
-
2003
-

 6sqft delivers the latest on real estate, architecture, and design, straight from New York City.
