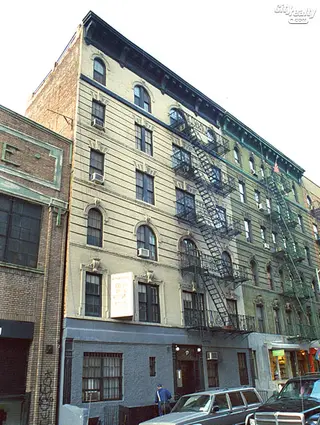
57 Thompson Street: Price Comparison
between Broome Street & Spring Street Building Profile
57 Thompson Street
N/A
Avg. Price
Past 12 months
Past 12 months
2024
-
2023
$592,500
2022
$515,000
2021
$900,000
2020
-
2019
-
2018
$938,275
2017
$759,800
2016
$647,500
2015
$611,500
2014
-
2013
-
2012
$330,000
2011
$450,650
2010
-
2009
$383,125
2008
$427,460
2007
$360,000
2006
$535,000
2005
$331,667
2004
$391,667
2003
$225,000
57 Thompson Street
N/A
Median Price
Past 12 months
Past 12 months
2024
-
2023
$592,500
2022
$515,000
2021
$900,000
2020
-
2019
-
2018
$938,275
2017
$615,000
2016
$652,500
2015
$611,500
2014
-
2013
-
2012
$330,000
2011
$450,650
2010
-
2009
$371,750
2008
$427,460
2007
$360,000
2006
$535,000
2005
$365,000
2004
$405,000
2003
$225,000
57 Thompson Street
N/A
Avg. Price
Past 12 months
Past 12 months
2024
-
2023
$592,500
2022
$420,000
2021
-
2020
-
2019
-
2018
-
2017
$427,500
2016
-
2015
$386,500
2014
-
2013
-
2012
$257,000
2011
-
2010
-
2009
-
2008
$292,560
2007
$300,000
2006
-
2005
$260,000
2004
-
2003
-
57 Thompson Street
N/A
Median Price
Past 12 months
Past 12 months
2024
-
2023
$592,500
2022
$420,000
2021
-
2020
-
2019
-
2018
-
2017
$427,500
2016
-
2015
$386,500
2014
-
2013
-
2012
$257,000
2011
-
2010
-
2009
-
2008
$292,560
2007
$300,000
2006
-
2005
$260,000
2004
-
2003
-
57 Thompson Street
N/A
Avg. Price
Past 12 months
Past 12 months
2024
-
2023
-
2022
$610,000
2021
$900,000
2020
-
2019
-
2018
$938,275
2017
$672,500
2016
$647,500
2015
$836,500
2014
-
2013
-
2012
$403,000
2011
$450,650
2010
-
2009
$383,125
2008
$562,360
2007
$420,000
2006
-
2005
$367,500
2004
$391,667
2003
$225,000
57 Thompson Street
N/A
Median Price
Past 12 months
Past 12 months
2024
-
2023
-
2022
$610,000
2021
$900,000
2020
-
2019
-
2018
$938,275
2017
$672,500
2016
$652,500
2015
$836,500
2014
-
2013
-
2012
$403,000
2011
$450,650
2010
-
2009
$371,750
2008
$562,360
2007
$420,000
2006
-
2005
$367,500
2004
$405,000
2003
$225,000
57 Thompson Street
N/A
Avg. Price
Past 12 months
Past 12 months
2024
-
2023
-
2022
-
2021
-
2020
-
2019
-
2018
-
2017
$1,599,000
2016
-
2015
-
2014
-
2013
-
2012
-
2011
-
2010
-
2009
-
2008
-
2007
-
2006
$535,000
2005
-
2004
-
2003
-
57 Thompson Street
N/A
Median Price
Past 12 months
Past 12 months
2024
-
2023
-
2022
-
2021
-
2020
-
2019
-
2018
-
2017
$1,599,000
2016
-
2015
-
2014
-
2013
-
2012
-
2011
-
2010
-
2009
-
2008
-
2007
-
2006
$535,000
2005
-
2004
-
2003
-
57 Thompson Street
N/A
Avg. Price
Past 12 months
Past 12 months
2024
-
2023
-
2022
-
2021
-
2020
-
2019
-
2018
-
2017
-
2016
-
2015
-
2014
-
2013
-
2012
-
2011
-
2010
-
2009
-
2008
-
2007
-
2006
-
2005
-
2004
-
2003
-
57 Thompson Street
N/A
Median Price
Past 12 months
Past 12 months
2024
-
2023
-
2022
-
2021
-
2020
-
2019
-
2018
-
2017
-
2016
-
2015
-
2014
-
2013
-
2012
-
2011
-
2010
-
2009
-
2008
-
2007
-
2006
-
2005
-
2004
-
2003
-
57 Thompson Street
N/A
Avg. Price
Past 12 months
Past 12 months
2024
-
2023
-
2022
-
2021
-
2020
-
2019
-
2018
-
2017
-
2016
-
2015
-
2014
-
2013
-
2012
-
2011
-
2010
-
2009
-
2008
-
2007
-
2006
-
2005
-
2004
-
2003
-
57 Thompson Street
N/A
Median Price
Past 12 months
Past 12 months
2024
-
2023
-
2022
-
2021
-
2020
-
2019
-
2018
-
2017
-
2016
-
2015
-
2014
-
2013
-
2012
-
2011
-
2010
-
2009
-
2008
-
2007
-
2006
-
2005
-
2004
-
2003
-

 6sqft delivers the latest on real estate, architecture, and design, straight from New York City.
