Skip to Content
66 Crosby Street - SoHo
66 Crosby Street
Co-Op in SoHo
  • Apartments
  • Overview & Photos
  • Maps
  • Floorplans
  • Sales Data & Comps
  • Similar Buildings
Get alerts with new listings in this building!
66 Crosby Street

66 Crosby Street

Co-op located in SoHo  Map

  • Apartments For Sale (1)
  • Recent Sales (6)
  • All Units in Building (40)
Unit #
Beds
Baths
Size
Price / Ft2
Price
Listed on
Days on Market
Unit #
Beds
Baths
Size
Closing Price
Price / Ft2
Asking Price
Sold on
View Full Sales History

Overview of 66 Crosby Street

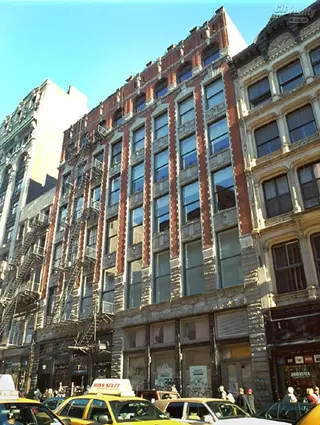
66 Crosby Street is a pre-war co-op building in downtown Manhattan's SoHo neighborhood finished in 1881 and converted in 2004. Historic features like façades of solid brick masonry, decorative stone cladding and cast iron remain intact. Amenities and staff include a full-time superintendent, video-entry phone security and a keyed elevator, dual zoned central HVAC, and large basement storage spaces.

Located in Soho's Cast-Iron Historic District, it is just steps away from some of New York's most special neighborhoods, including Little Italy, NoHo, Nolita, the Lower East Side and Chinatown. Shopping, entertainment, and restaurants abound in this extraordinary neighborhood which is conveniently located to major subway lines.


This co-op building allows pied-a-terre, gifting, guarantors on a case by case basis, and allows subletting for up to five aggregate years after the third year of ownership.


Year Built
1881
Converted: 2004
Apartments
40
Floors
6
Pets: Allowed
Neighborhood
Min Down
25%
40Apartments
View All Past
Sales & Rentals
in Building

Schedule a Visit

Select when you would like to view apartments.
Sat
22
Sun
23
Mon
24
Tue
25
Wed
26
Thu
27
Fri
28
Sat
01
Sun
02
Mon
03

What Time?

9am-noon
Noon-3pm
3pm-6pm
Any time
You can also call us anytime at
☎️ (212) 755-5544

Amenities

  • Pre War
  • Resident Storage
  • Intercom
  • Washer/Dryer in building
  • Elevator
  • Fitness Center
  • Live-In Superintendent

Learn more about off-market listings at 66 Crosby Street!

{ "key" : "AIzaSyDquABdSLhathmwfnoTcYwA1BY6coZZyZk", "lat": 40.72244, "lng": -73.9986, "marker": { "icon": "https://img3.cityrealty.com/neo/i/w/amenities/base.png" } }

Nearby Subways

  1. 6
at Lafayette 0.08 miles
  1. N
  2. R
at Broadway 0.14 miles
  1. M
  2. B
  3. D
  4. F
at Houston 0.23 miles
  1. J
  2. Z
  3. Q
at Broadway 0.26 miles
  1. A
  2. C
  3. E
at Thompson 0.36 miles
  1. 1
at Varick 0.40 miles

Nearby Schools

  1. Ps 130 Hernando De Soto
    Grades: PK,KG,1,2,3,4,5
  2. Chelsea Career And Technical Education High School
    Grades: 9,10,11,12
  3. NYC iSchool
    Grades: 9,10,11,12
  4. Forsythe Satellite Academy
    Grades: 9,10,11,12
  5. Cascades High School
    Grades: 9,10,11,12
Data courtesy of GreatSchools.org
  1. St. Anthonys School
    Grades: UG
  2. Nativity Mission School
    Grades: 8
  3. Elisabeth Irwin High School
    Grades: PK,TK,KG,1,2,3,4,5,6,7,8,9,10,11,12
  4. Portfolio School
    Grades: KG,1,2,3,4,5,6,7
  5. Nord Anglia International School New York
    Grades: PK,TK,KG,1,2,3,4,5,6,7,8
Data courtesy of GreatSchools.org
Loading...

66 Crosby Street Floorplans

Apt 4B
2 beds, 1 bath, Approx. 1,420 ft2
Apt 2GH
3 beds, 3 baths, Approx. 5,200 ft2
Last sold for $3,810,000
on Sep 6, 2023
View Unit History
Apt 5E
2 beds, 1.5 baths, Approx. ft2
Last sold for $2,100,000
on Sep 7, 2022
View Unit History
Apt 4G
1 bed, 1 bath, Approx. 1,400 ft2
Last sold for $1,600,000
on Oct 5, 2021
View Unit History
Apt 5F
1 bed, 1 bath, Approx. 1,700 ft2
Last sold for $1,875,000
on Jul 1, 2021
View Unit History
Apt 5G
1 bed, 1 bath, Approx. 1,400 ft2
Last sold for $1,825,000
on May 2, 2019
View Unit History
View All Floorplans

Sales History

Price/Room (Est)

Why are we displaying the estimated price per room?

For some co-ops, instead of price per square foot, we use an estimate of the number of rooms for each sold apartment to chart price changes over time. This is because many co-op listings do not include square footage information, and this makes it challenging to calculate accurate square-foot averages.

By displaying the price per estimated room count, we are able to provide a more reliable and consistent metric for comparing sales in the building. While we hope that this gives you a clearer sense of price trends in the building, all data should be independently verified. All data provided are only estimates and should not be used to make any purchase or sale decision.

Price/Ft2 (Est)
View Full Closing History
Year
Avg Price / Ft2 (Est) Median Price / Ft2 (Est) Avg. Actual Price Med. Actual Price
Transactions
2025
-
-
-
-
0
2024
-
-
-
-
0
2023
$733
$3,810,000
$733
$3,810,000
1
2022
-
$2,100,000
-
$2,100,000
1
2021
$1,130
$2,153,000
$1,143
$1,875,000
5
2020
-
-
-
-
0
2019
$1,662
$2,025,000
$1,601
$1,937,500
4
2018
$1,141
$1,936,667
$1,147
$1,950,000
3
2017
-
-
-
-
0
2016
-
-
-
-
0
2015
$1,888
$2,360,000
$1,888
$2,360,000
1
2014
-
$2,057,500
-
$2,057,500
1
Year
Avg Price / Ft2 (Est) Median Price / Ft2 (Est) Avg. Actual Price Med. Actual Price
Transactions
2013
-
-
-
-
0
2012
$1,246
$2,206,250
$1,373
$1,825,000
4
2011
$886
$1,270,000
$886
$1,270,000
2
2010
$812
$1,451,667
$812
$1,470,000
3
2009
-
-
-
-
0
2008
$869
$1,825,000
$869
$1,825,000
1
2007
$957
$1,487,000
$957
$1,487,000
2
2006
$908
$1,659,400
$908
$1,562,000
5
2005
-
$1,755,833
$1,850,000
3
2004
$625
$1,640,000
$625
$1,050,000
3
2003
$593
$846,333
$593
$946,000
3
Please note that price/ft2 calculations is from only 62% of total transactions during the period
Year
Avg Price / Room (Est) Avg. Actual Price Med. Actual Price
Transactions
2025
-
-
0
2024
-
-
0
2023
$544,286
$3,810,000
1
2022
$466,667
$2,100,000
1
2021
$707,444
$2,153,000
5
2020
-
-
0
2019
$578,125
$2,025,000
4
2018
$591,389
$1,936,667
3
2017
-
-
0
2016
-
-
0
2015
$590,000
$2,360,000
1
2014
$823,000
$2,057,500
1
Year
Avg Price / Room (Est) Avg. Actual Price Med. Actual Price
Transactions
2013
-
-
0
2012
$506,875
$2,206,250
4
2011
$423,333
$1,270,000
2
2010
$387,222
$1,451,667
3
2009
-
-
0
2008
$608,333
$1,825,000
1
2007
$425,875
$1,487,000
2
2006
$367,013
$1,659,400
5
2005
$308,333
$1,755,833
3
2004
$333,373
$1,640,000
3
2003
$218,250
$846,333
3

Sales History by Apartment Size

View Full Closing History
Show:
Created with Highstock 5.0.0Price/Room20042005200620072008200920102011201220132014201520162017201820192020202120222023$0$500,000$1,000,000$1,500,000$2,000,000

Pricing Comparison of Similar Buildings

View Detailed Comparison
Average Price per Sq. Ft.
$369,000
-
$332,100
-
$295,200
-
$258,300
-
$221,400
-
$184,500
-
$147,600
-
$110,700
-
$73,800
-
$36,900
-
$0
-
West Village Houses
 

Similar Buildings

520 Fifth Avenue
at the northwest corner of West 43rd Street
Midtown West
Iconic river-to-river views include the Empire State Building and Central Park. Elevated condos with magnificent arched windows, triple exposures, and soaring ceilings | Occupancy 2026.
Learn More

the following is a slider of images. For screen reader users, all slides are visible at all time so you may ignore control buttons.


Before you move on from this page

Sign-up and we'll email you new listings in this building!

or
Save Building with Email
By continuing you accept the Terms & Privacy Policy