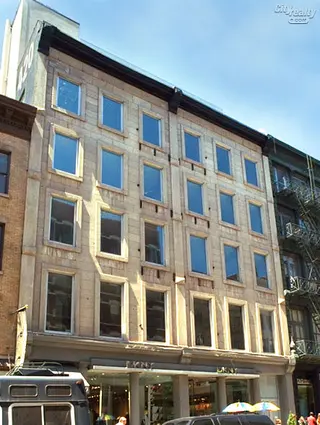
The Soho Gallery Building, 420 West Broadway - SoHo
- Apartments
- Overview & Photos
- Maps
- Floorplans
- Sales Data & Comps
- Similar Buildings
- All Units
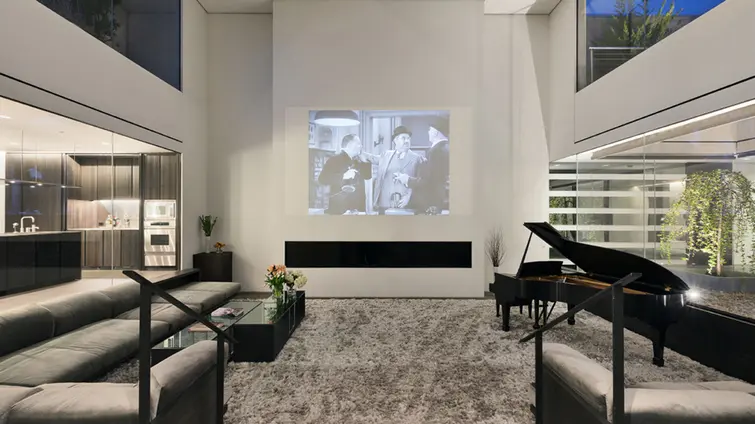
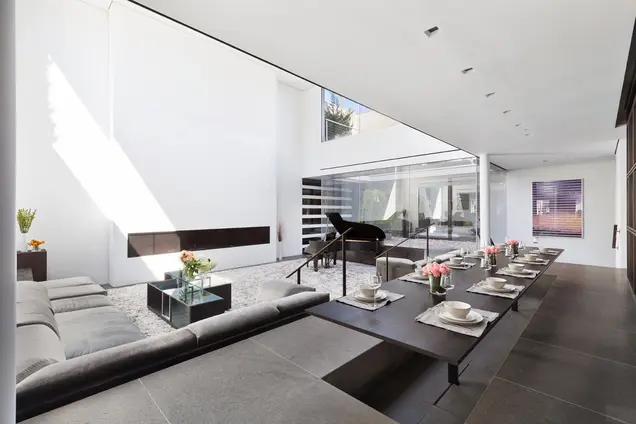
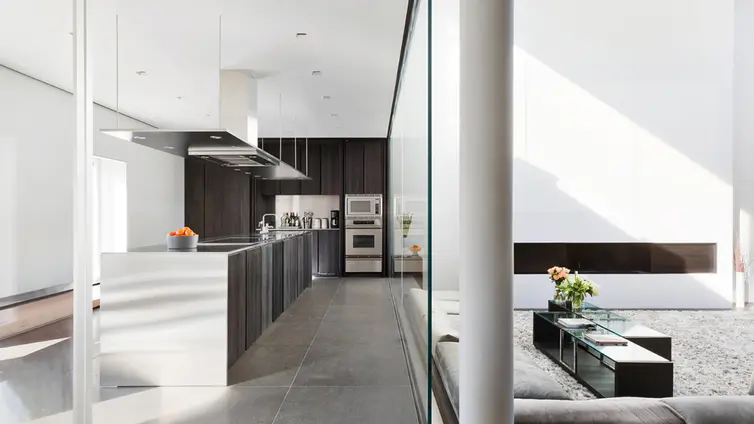
Built in 1910, the Soho Gallery Building was the first and foremost gallery building in Soho. Once home to Leo Castelli and other leading art dealers, this elegant structure served as the hub of the Soho art scene, attracting art lovers from around the world to view the works of such luminaries as Jasper Johns and Roy Lichtenstein. Converted in 2000, 420 West Broadway is now a 7-story, 9-unit co-operative building. the building offers two entrances---Broadway or Thompson Street---and a doorman is on duty seven days a week from 7 a.m. to 11 p.m.

View school info, local attractions, transportation options & more.
Experience amazing 3D aerial maps and fly throughs.
For some co-ops, instead of price per square foot, we use an estimate of the number of rooms for each sold apartment to chart price changes over time. This is because many co-op listings do not include square footage information, and this makes it challenging to calculate accurate square-foot averages.
By displaying the price per estimated room count, we are able to provide a more reliable and consistent metric for comparing sales in the building. While we hope that this gives you a clearer sense of price trends in the building, all data should be independently verified. All data provided are only estimates and should not be used to make any purchase or sale decision.