St. John's Condominium, 259 21st Street - Condo in South Slope - Greenwood Heights
- Apartments
- Overview & Photos
- Maps
- Floorplans
- Sales Data & Comps
- Similar Buildings
- All Units

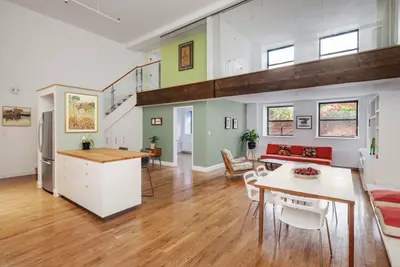
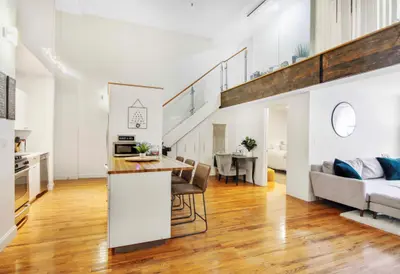
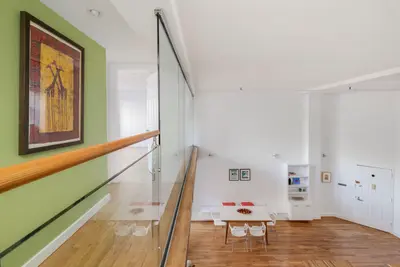
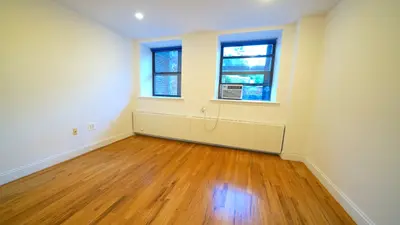
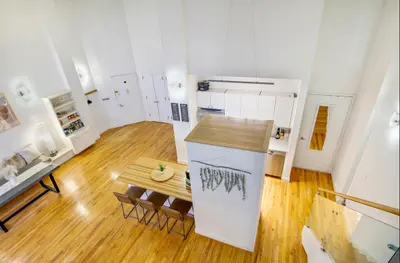
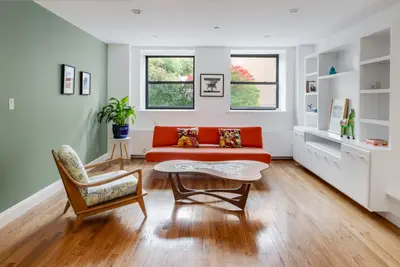
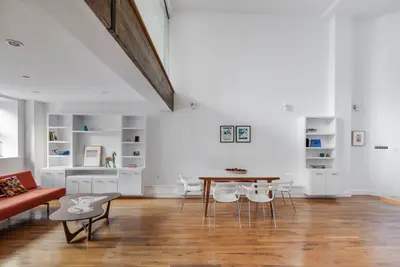
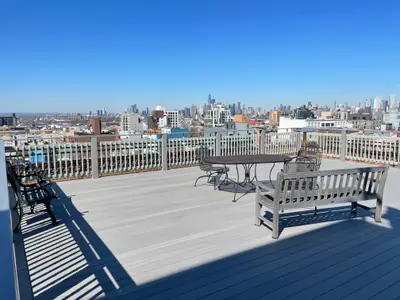
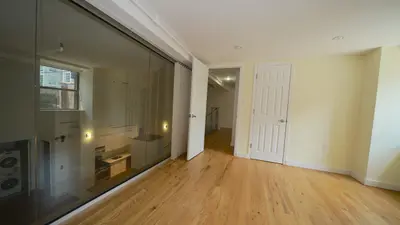
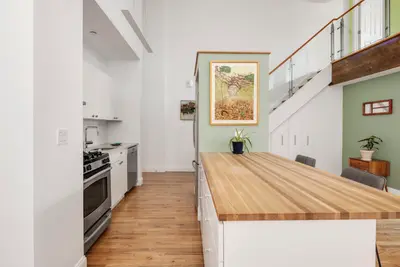

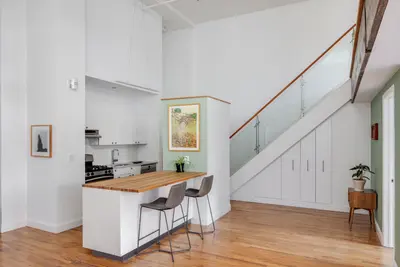
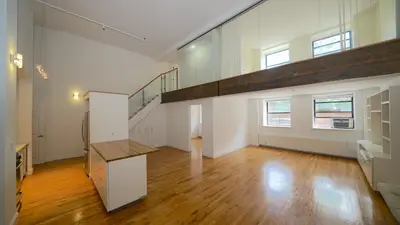
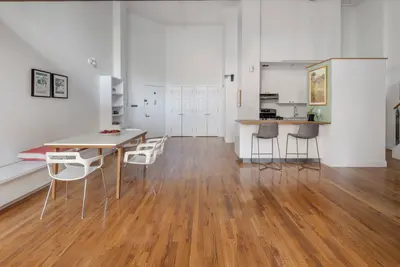
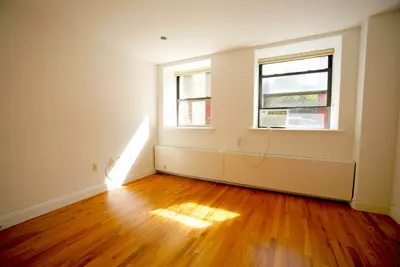
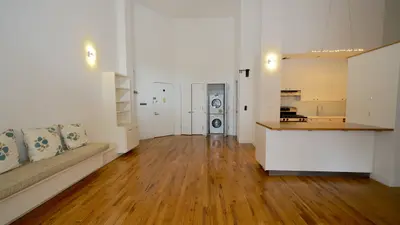
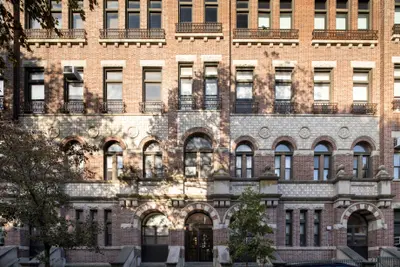
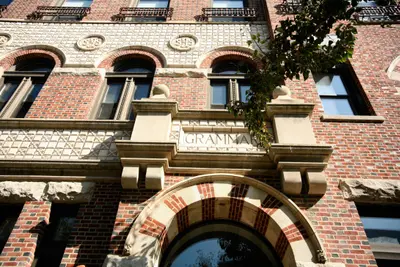
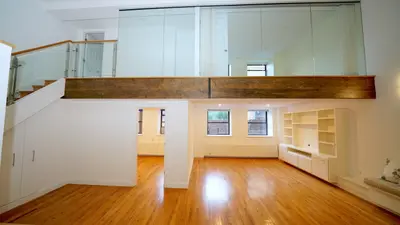
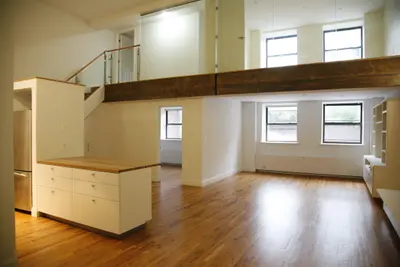
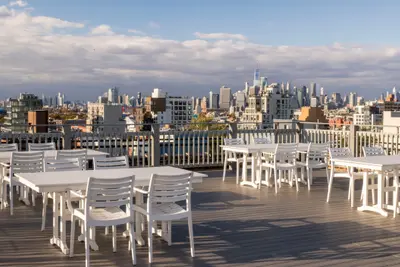
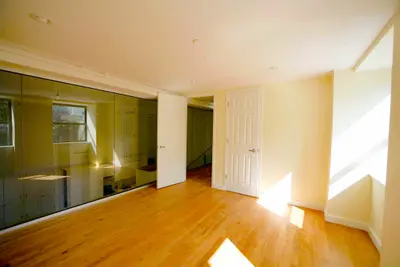
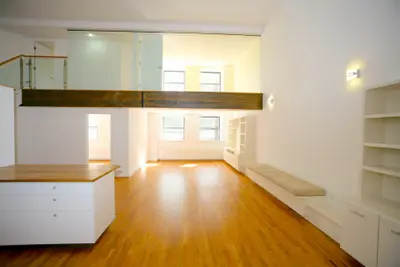

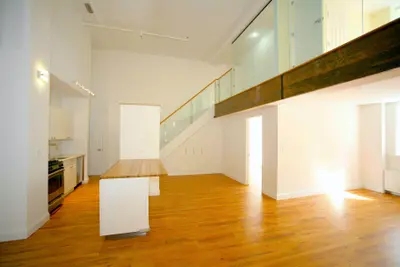
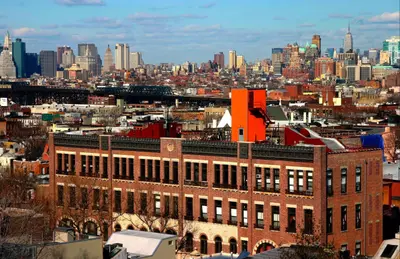
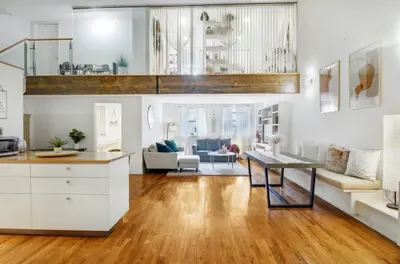
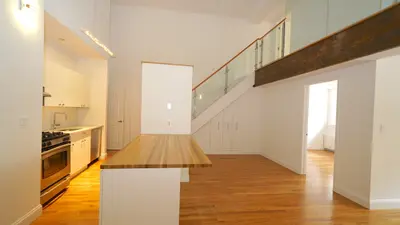
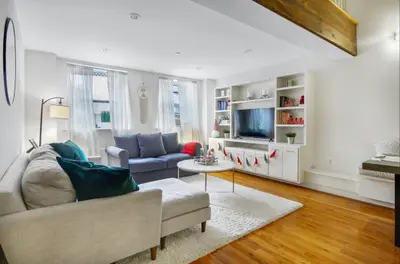
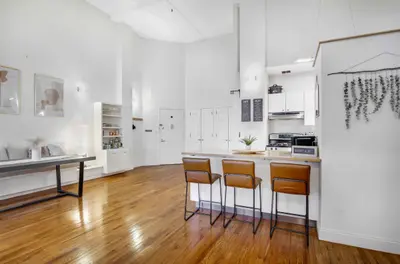
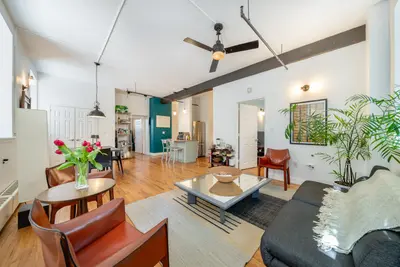
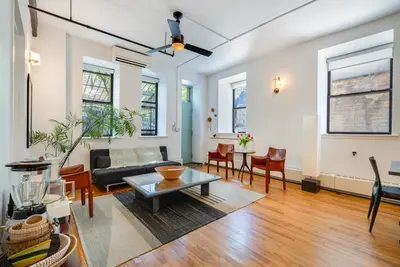
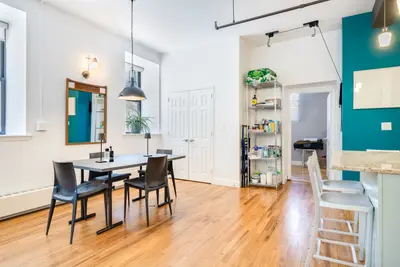
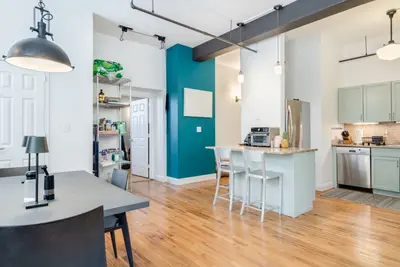
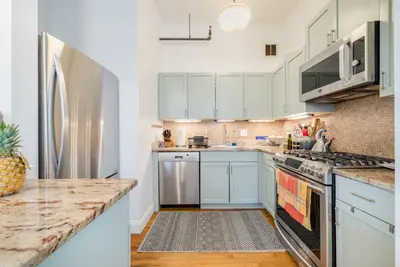
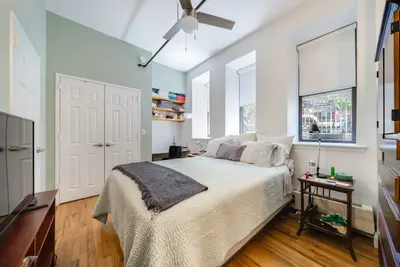
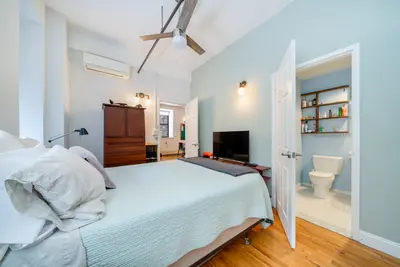
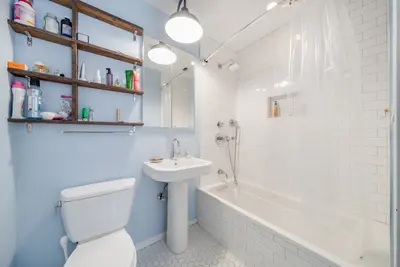

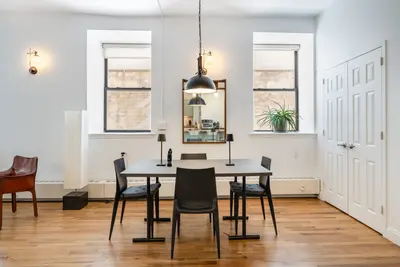

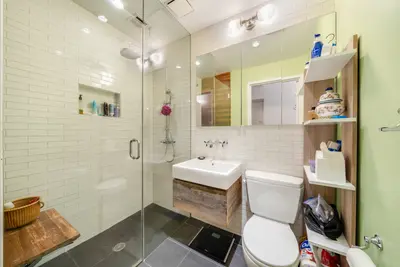
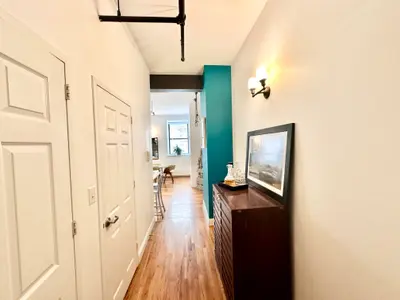
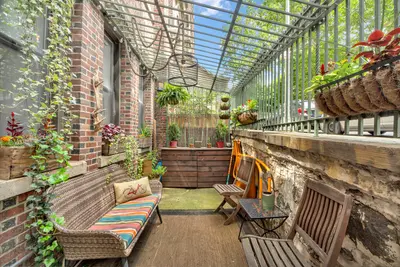
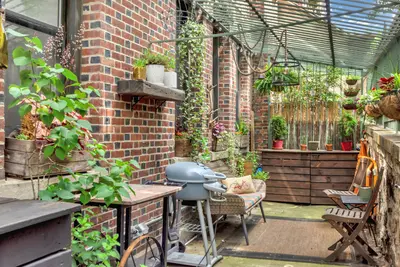
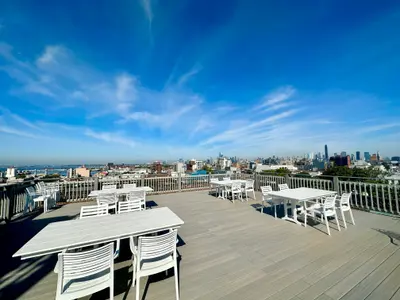
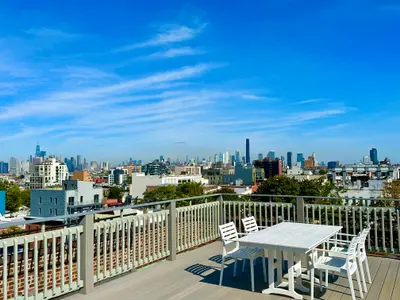
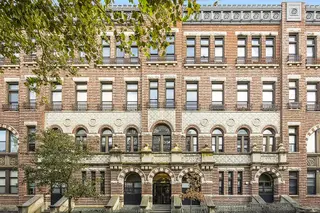
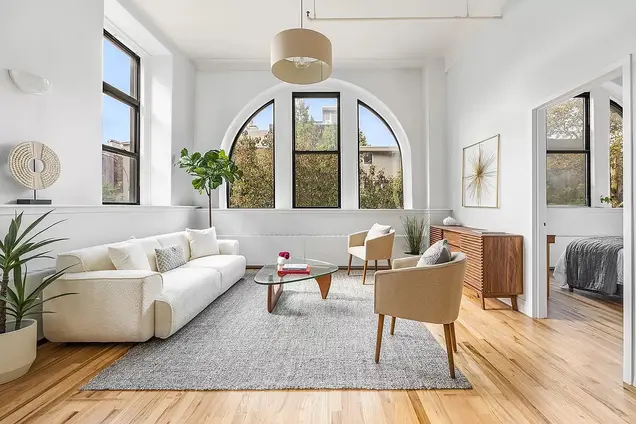
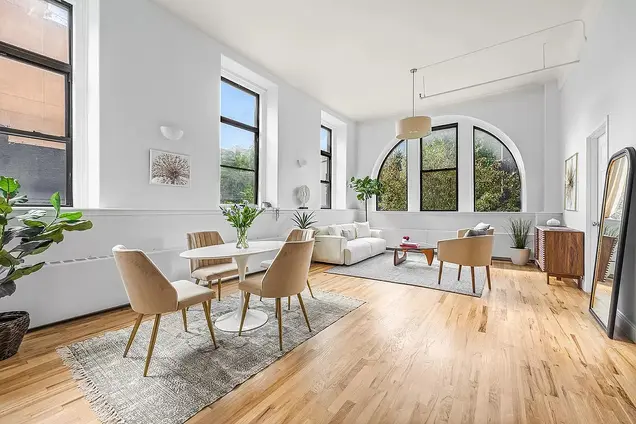
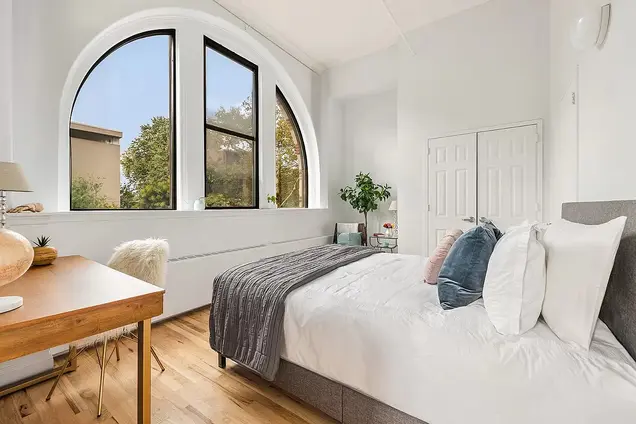
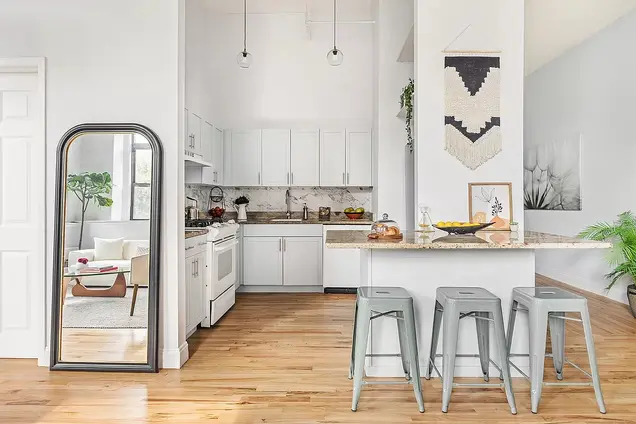
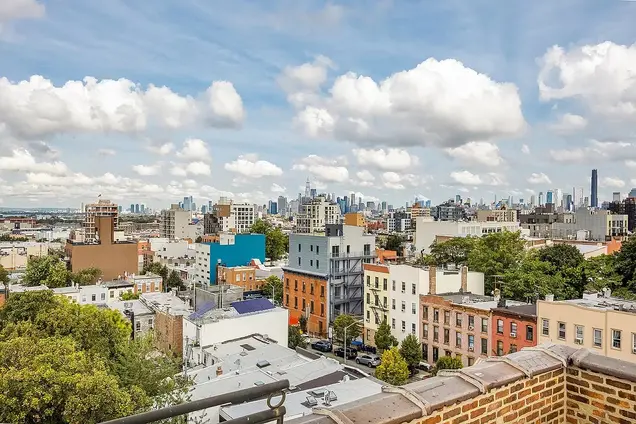
Situated in the vibrant South Slope - Greenwood Heights neighborhood, the highly sought-after Saint John's Condominium comprises 38 units within a meticulously renovated and converted historic building. Originally constructed as a grammar school in 1904, the property underwent a full transformation into loft condominiums in 2006. This pet-friendly residence boasts amenities such as a spacious elevator, bike room, and a dedicated live-in superintendent. Notably, it features an expansive 5,000-square-foot communal rooftop deck, offering panoramic views of the harbor, Statue of Liberty, and city skyline.
The architectural uniqueness of the building adds to its charm, set on a tranquil, tree-lined street. Conveniently located near the vibrant commercial strips of 5th and 6th Avenues, including Tambour, Sea Witch, Gasworks NYC clay studio, Under Minerva Gallery, Battle Hill Tavern, Luigi’s, and Hey Monday Coffee Shop. Proximity to R and F/G subways, B63 bus, numerous schools, daycare options, the playground at 6th Avenue and 19th Street, and a short walk to Prospect Park makes it an ideal Brooklyn living experience.
View school info, local attractions, transportation options & more.
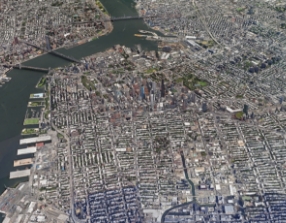
Experience amazing 3D aerial maps and fly throughs.