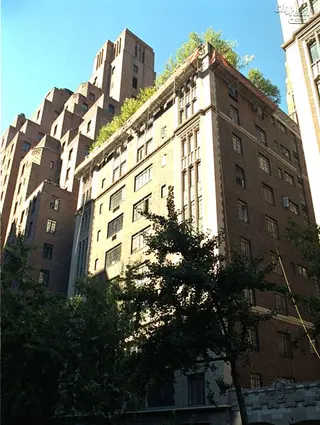
Shh... Many units sell without being publicly listed.
Limited off-market opportunities might be available at The Essex House – ideal for those looking to explore listings not currently on the market. Contact us to learn more.
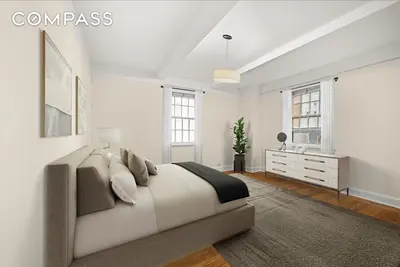
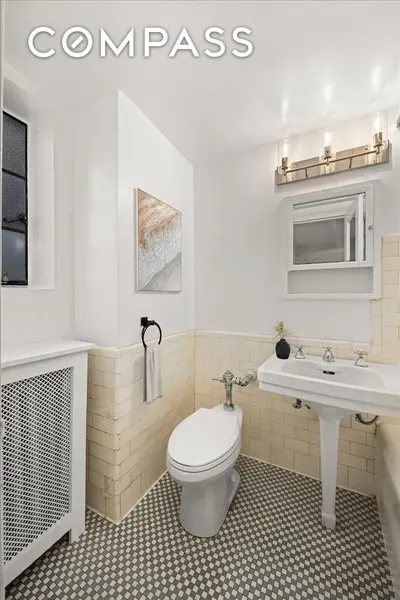
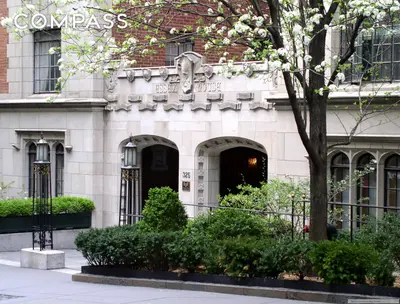
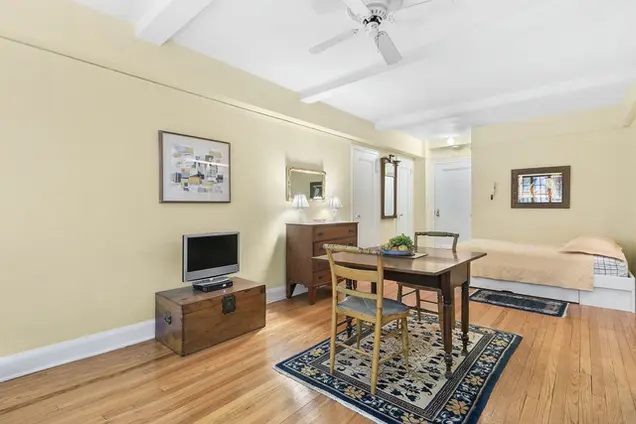
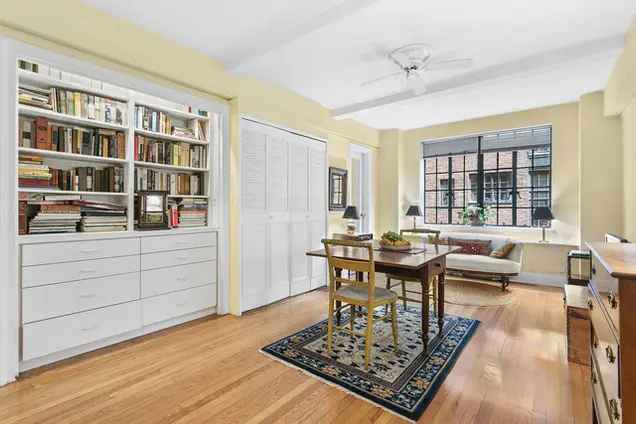
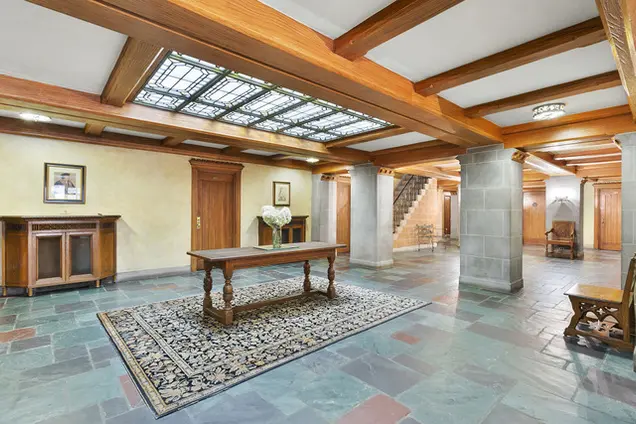
The Essex House is a full-service cooperative located at 325 East 41st Street, in the landmarked Tudor City district. A 24-hour doorman and live-in resident manager are on staff, and amenities include a common courtyard, bike room, and central laundry room. Pets and pied-a-terres are welcome, and the building is well situated near exquisitely manicured parks and playgrounds, Grand Central Terminal, and excellent shopping and dining.
Limited off-market opportunities might be available at The Essex House – ideal for those looking to explore listings not currently on the market. Contact us to learn more.
View school info, local attractions, transportation options & more.
Experience amazing 3D aerial maps and fly throughs.
For some co-ops, instead of price per square foot, we use an estimate of the number of rooms for each sold apartment to chart price changes over time. This is because many co-op listings do not include square footage information, and this makes it challenging to calculate accurate square-foot averages.
By displaying the price per estimated room count, we are able to provide a more reliable and consistent metric for comparing sales in the building. While we hope that this gives you a clearer sense of price trends in the building, all data should be independently verified. All data provided are only estimates and should not be used to make any purchase or sale decision.
Year
Avg Price / Ft2 (Est)
Median Price / Ft2 (Est)
Avg. Actual Price
Med. Actual Price
Transactions
2025
-
$589,000
-
$589,000
1
2024
$875
$962,250
$875
$962,250
2
2023
$838
$617,500
$836
$615,000
4
2022
$879
$570,000
$879
$522,500
6
2021
$808
$1,162,000
$808
$955,000
5
2020
$682
$897,500
$682
$897,500
2
2019
$739
$703,571
$739
$560,000
7
2018
$1,021
$1,192,933
$1,021
$999,800
3
2017
$909
$820,929
$883
$892,500
7
2016
$822
$703,500
$795
$812,500
6
2015
$906
$1,299,800
$906
$880,000
5
2014
$669
$681,043
$659
$725,000
7
|
Year
Avg Price / Ft2 (Est)
Median Price / Ft2 (Est)
Avg. Actual Price
Med. Actual Price
Transactions
2013
$742
$730,025
$695
$630,000
6
2012
$685
$685,000
$685
$685,000
2
2011
$693
$592,800
$682
$733,500
5
2010
$649
$701,875
$657
$697,500
8
2009
$712
$570,000
$703
$532,500
4
2008
$871
$729,850
$758
$717,500
6
2007
$760
$786,214
$761
$775,000
7
2006
$642
$693,750
$642
$695,000
4
2005
$539
$472,143
$615
$475,000
7
2004
$521
$520,429
$510
$599,000
7
2003
$412
$419,000
$400
$447,500
6
Please note that price/ft2 calculations is from only 62% of total transactions during the period
|
Sign-up and we'll email you new listings in this building!
Whether you’re a buyer, investor, or simply curious, this report is your key to unlocking in-depth insights and analysis on .
Please confirm your details:
Broker & Buyer Comments