Shh... Many units sell without being publicly listed.
Interested in off-market listings at The River Arts? Some previously listed residences might be available – contact us for insider details on potential opportunities!
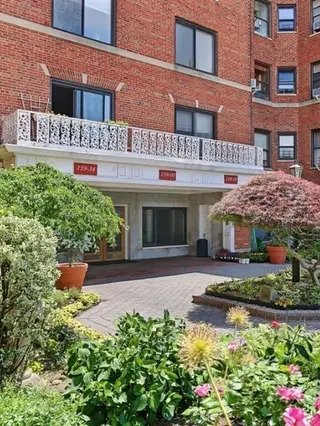
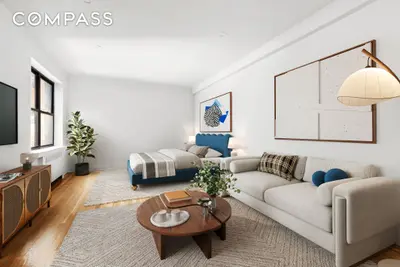
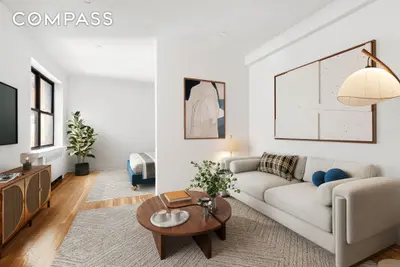
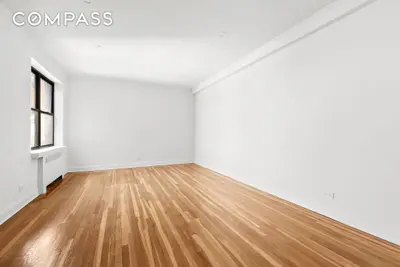
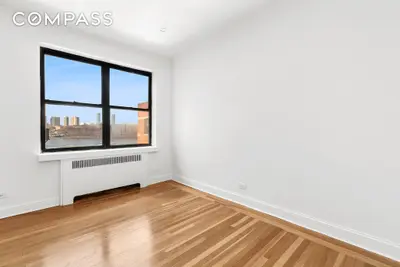
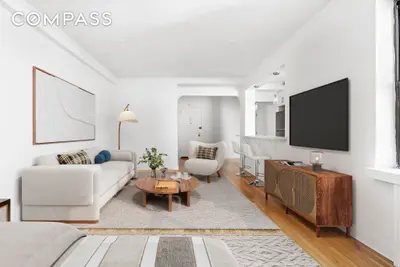
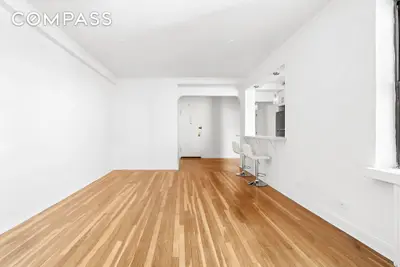
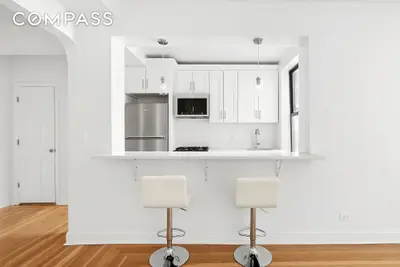
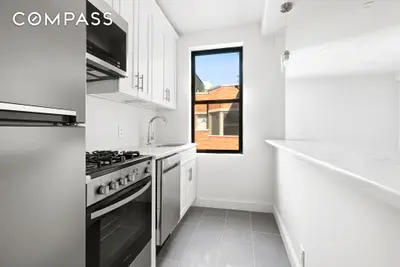
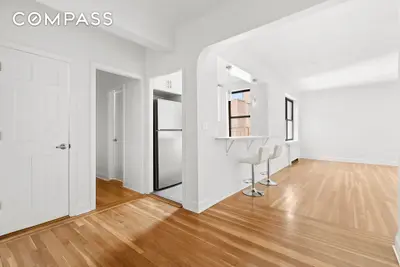
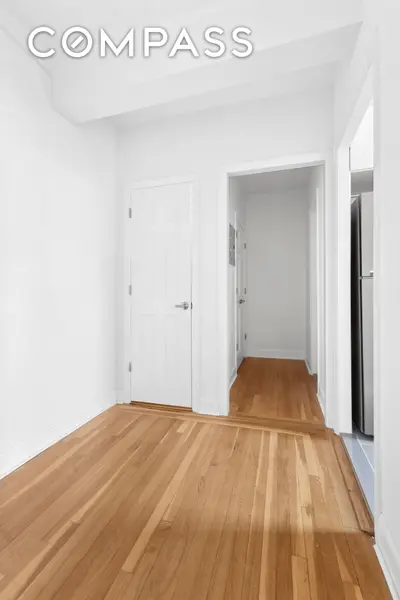
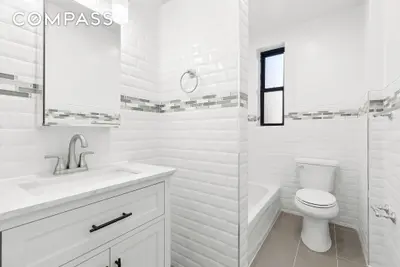

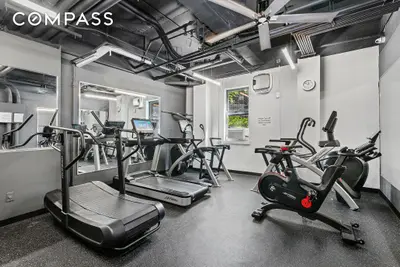


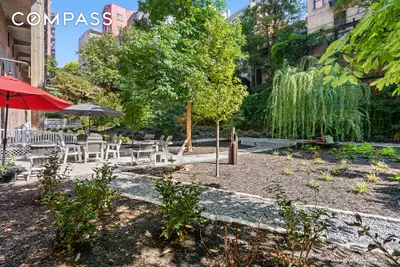


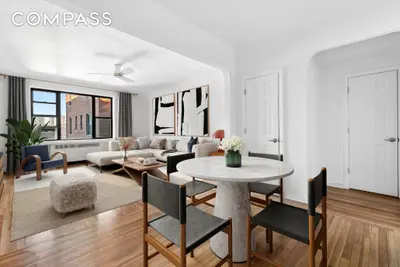
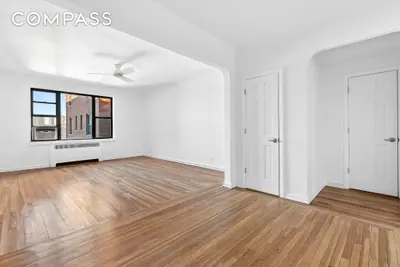
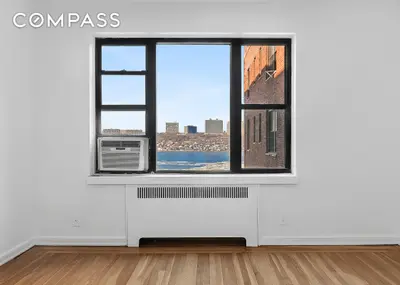
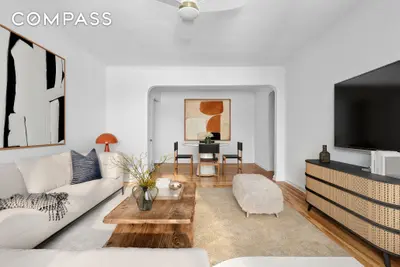
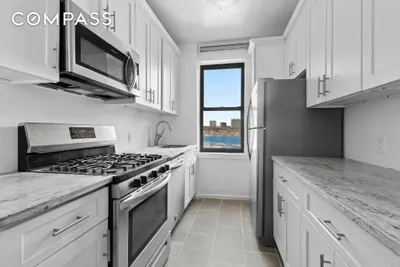
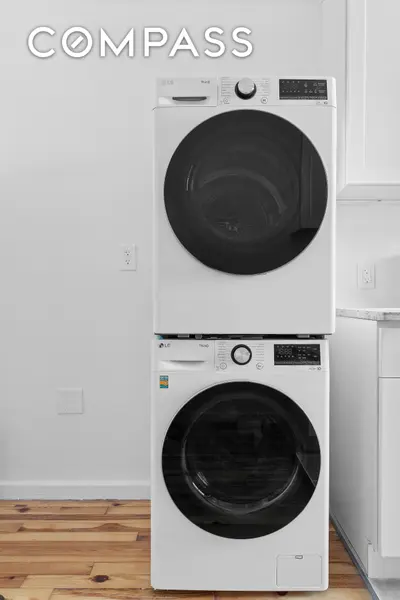
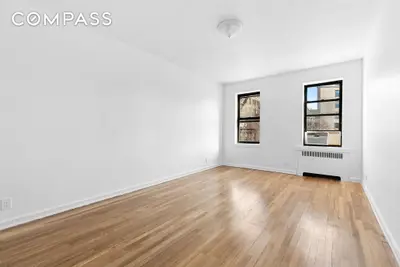
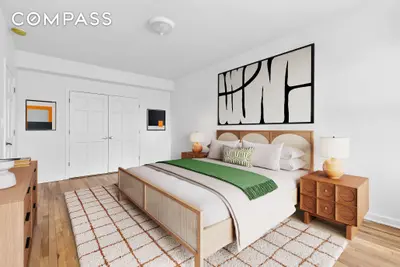
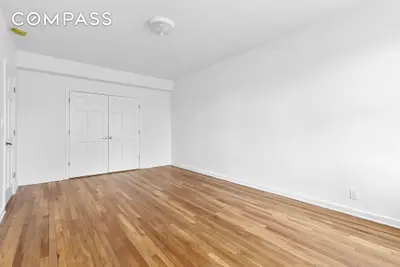


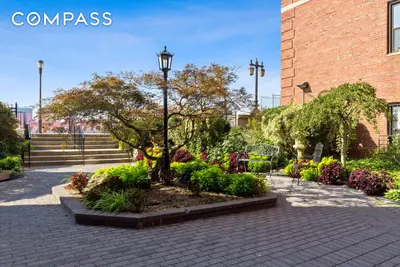

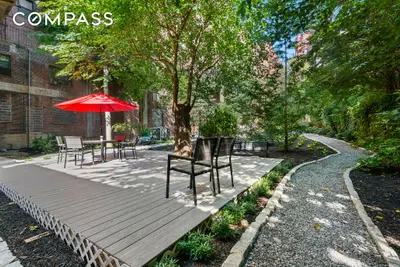
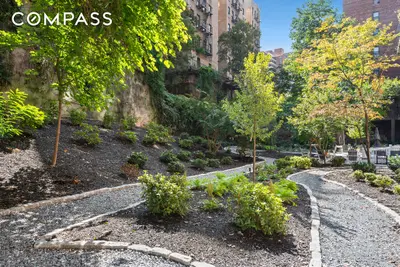

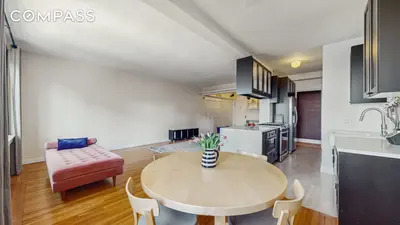
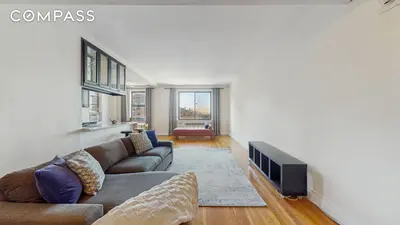
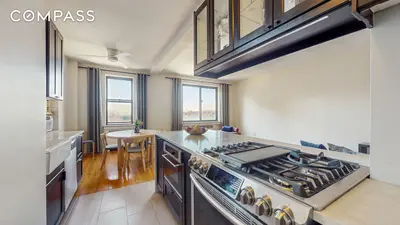
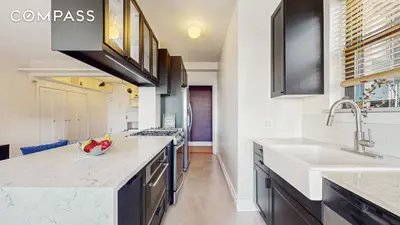
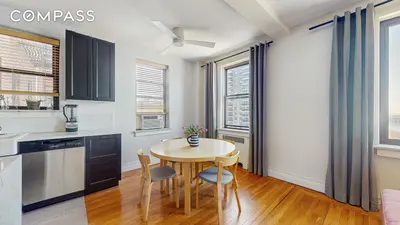
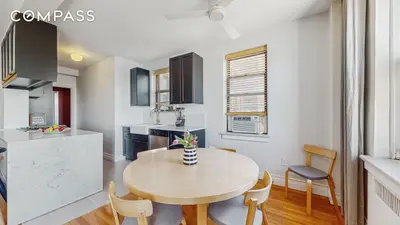
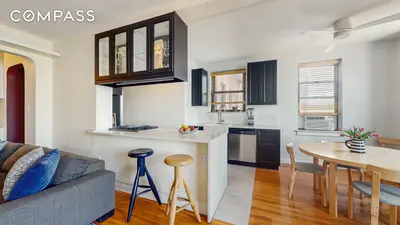
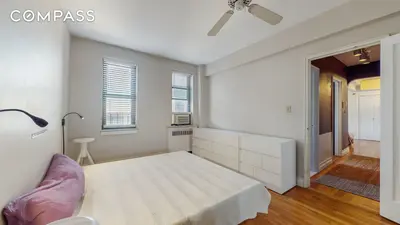
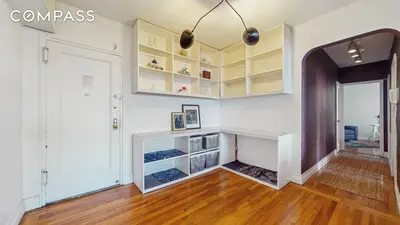


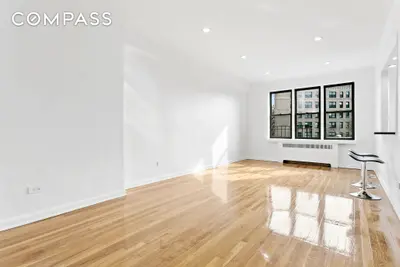
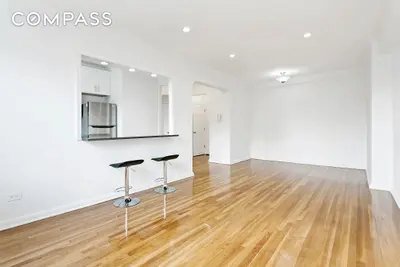
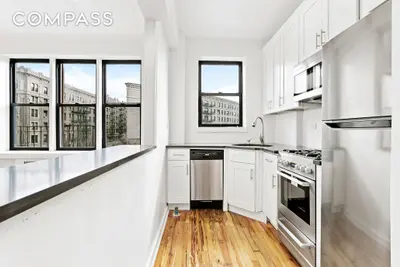
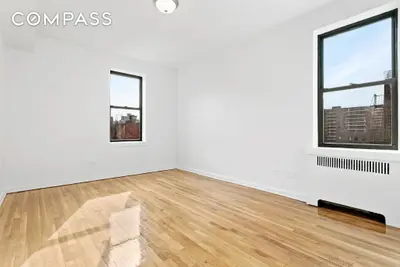
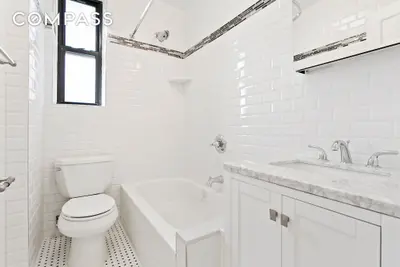

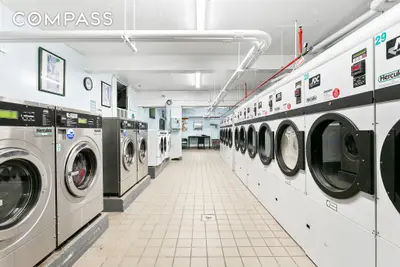
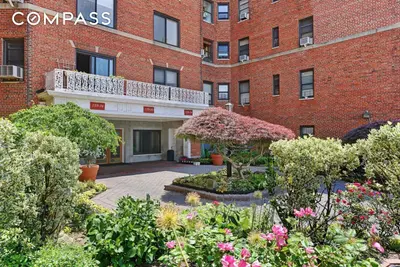


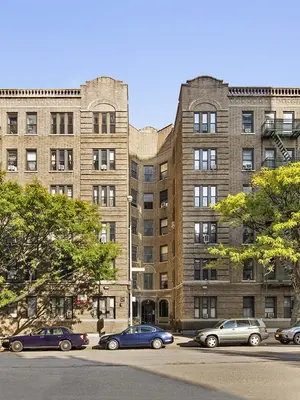
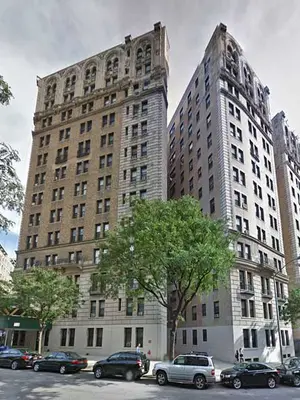
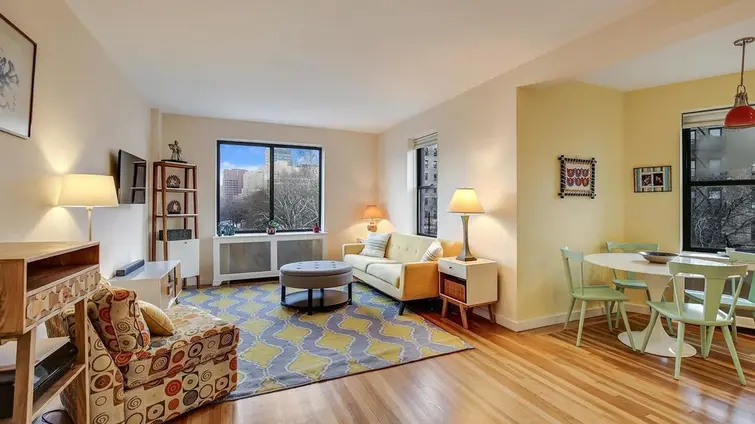
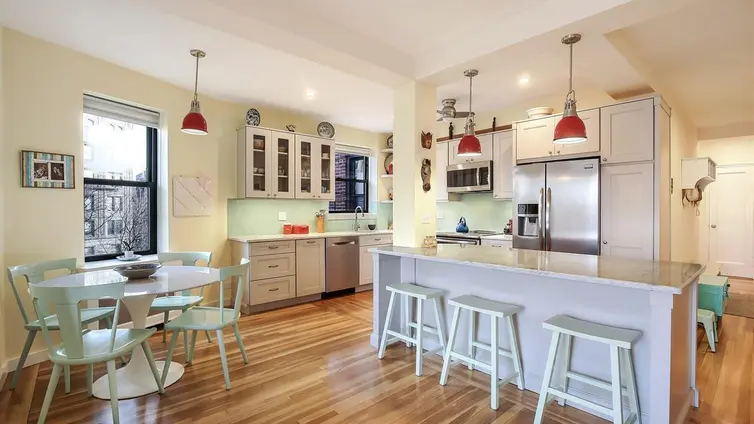
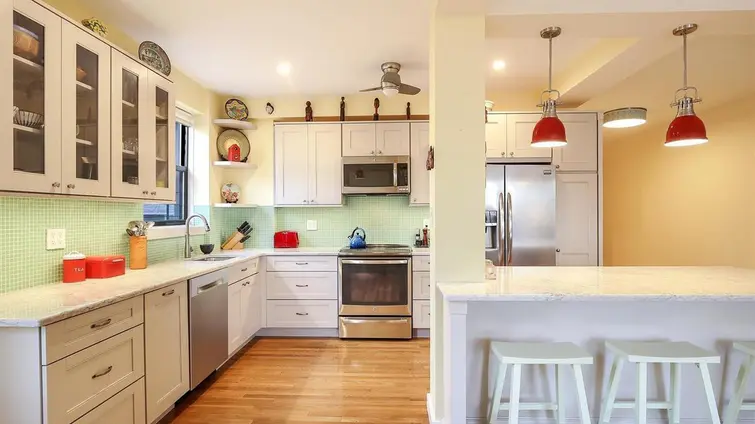
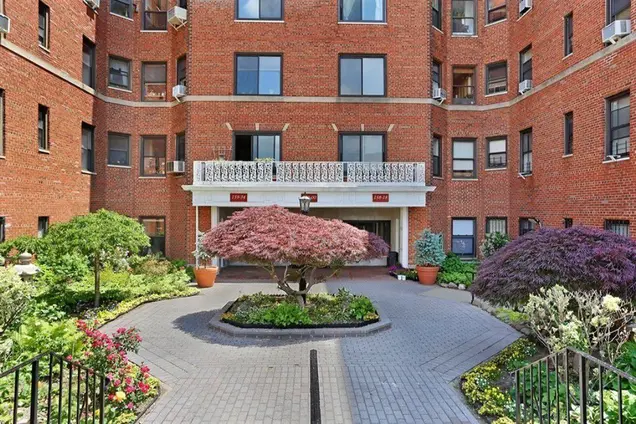
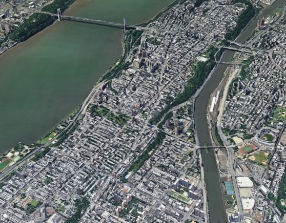
The River Arts is a prewar cooperative situated at 871 Riverside Drive along the Hudson River. A full-time doorman and live-in superintendent are on staff, and amenities include a gym, common outdoor space, bike room, parking garage, central laundry room, community room, and storage space. Additionally, the building has added solar panels and compost bins.
One dog per apartment is permitted, and breed restrictions are in place. The 1, A, and C trains are a short walk away.
Interested in off-market listings at The River Arts? Some previously listed residences might be available – contact us for insider details on potential opportunities!
View school info, local attractions, transportation options & more.
Experience amazing 3D aerial maps and fly throughs.
For some co-ops, instead of price per square foot, we use an estimate of the number of rooms for each sold apartment to chart price changes over time. This is because many co-op listings do not include square footage information, and this makes it challenging to calculate accurate square-foot averages.
By displaying the price per estimated room count, we are able to provide a more reliable and consistent metric for comparing sales in the building. While we hope that this gives you a clearer sense of price trends in the building, all data should be independently verified. All data provided are only estimates and should not be used to make any purchase or sale decision.
|
Year
Avg Price / Room (Est)
Avg. Actual Price
Med. Actual Price
Transactions
2025
-
-
0
2024
$196,917
$1,057,500
4
2023
$203,605
$660,009
7
2022
$198,887
$794,015
12
2021
$194,120
$818,333
9
2020
$200,167
$808,000
4
2019
$189,667
$569,000
1
2018
$207,348
$808,681
11
2017
$171,018
$750,200
10
2016
$174,833
$656,250
4
2015
$133,750
$535,000
2
2014
$147,343
$648,313
8
|
Year
Avg Price / Room (Est)
Avg. Actual Price
Med. Actual Price
Transactions
2013
$145,058
$507,250
10
2012
$95,859
$396,426
6
2011
$136,700
$537,500
6
2010
$127,500
$633,667
3
2009
$123,542
$626,250
4
2008
$229,000
$700,000
2
2007
$176,833
$543,667
3
2006
$155,111
$535,000
9
2005
$156,528
$588,106
7
2004
$71,250
$317,786
7
2003
$65,424
$223,667
6
|
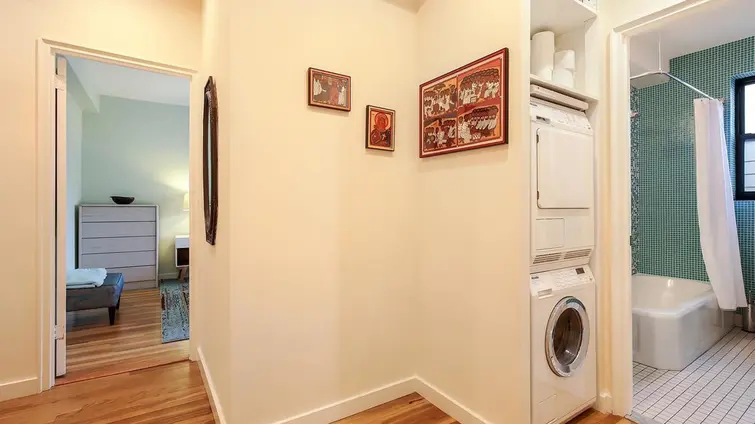
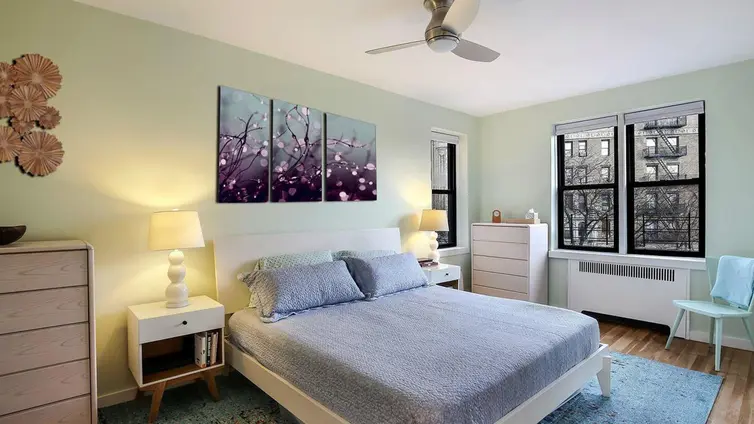
the following is a slider of images. For screen reader users, all slides are visible at all time so you may ignore control buttons.
Sign-up and we'll email you new listings in this building!
Whether you’re a buyer, investor, or simply curious, this report is your key to unlocking in-depth insights and analysis on .
Please confirm your details: