
West Gate House,
870 West 181st Street
co-op located in Washington Heights, between Cabrini Boulevard & Haven Avenue
- Recent Sales (4) $510 Avg. price/ft2
- All Units in Building (61)
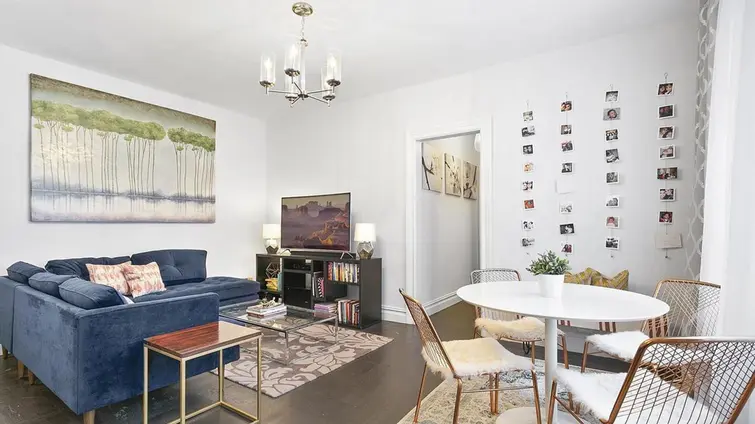
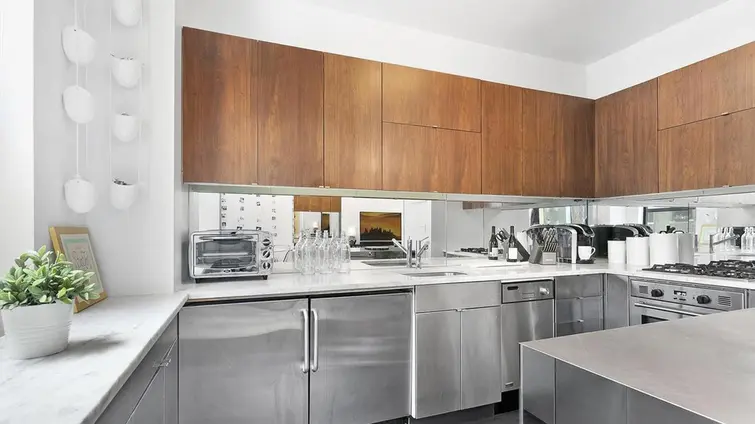
Overview of West Gate House at 870 West 181st Street
West Gate House co-op is a six-story, 123-unit cooperative dating back to 1923. It has renovated lobbies, freshly skim-coated and painted common area hallways and stairwells, and an intercom system that connects directly to smart phones to allow entry permission for packages and guests. Energy-saving upgrades include new movement detection lighting in the common areas and thermostatic control radiator valves.
The building welcomes pets, and amenities and staff include a live-in superintendent, porter, garden courtyards, two laundry rooms, bike room, and storage lockers. Located at 870 West 181st Street, it is well situated near local tennis courts, running/jogging tracks, bike paths, gardens, and sports fields of Fort Tryon Park and Fort Washington Parks.
Sales & Rentals
in Building
Amenities
- Resident Storage
- Video Intercom
- Elevator
- Courtyard
- Laundry Room
- Bike Room
- Live-In Superintendent

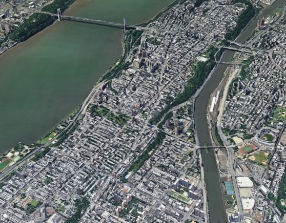
Maps &
3D Aerial Views
View school info, local attractions, transportation options & more.
Experience amazing 3D aerial maps and fly throughs.
Nearby Subways
- A
- 1
Sales History
Why are we displaying the estimated price per room?
For some co-ops, instead of price per square foot, we use an estimate of the number of rooms for each sold apartment to chart price changes over time. This is because many co-op listings do not include square footage information, and this makes it challenging to calculate accurate square-foot averages.
By displaying the price per estimated room count, we are able to provide a more reliable and consistent metric for comparing sales in the building. While we hope that this gives you a clearer sense of price trends in the building, all data should be independently verified. All data provided are only estimates and should not be used to make any purchase or sale decision.
Sales Summary
View Summary by Apartment SizeSales History by Apartment Size
View Full Closing HistoryPricing Comparison of Similar Buildings
View Detailed ComparisonEditorial Coverage
Alternate Addresses
- 361 Haven Avenue
- 363 Haven Avenue
- 365 Haven Avenue
- 367 Haven Avenue
- 369 Haven Avenue
- 371 Haven Avenue
- 373 Haven Avenue
- 375 Haven Avenue
- 377 Haven Avenue
- 379 Haven Avenue
- 381 Haven Avenue
- 383 Haven Avenue
- 385 Haven Avenue
- 387 Haven Avenue
- 389 Haven Avenue
- 391 Haven Avenue
- 393 Haven Avenue
- 395 Haven Avenue
- 397 Haven Avenue
- 399 Haven Avenue
- 862 West 181st Street
- 864 West 181st Street
- 866 West 181st Street
- 868 West 181st Street
- 870 West 181
latest news around New York City real estate. Follow us on Twitter to keep up with the trends and
latest news around New York City real estate. Follow us on Instagram. Follow us on Linkedin.
-
Buy & Sell
Search Apts for Sale Market Reports Buyer’s Guide Find an Agent Market Data Selling Your Apartment -
Rent
Search Apts for Rent Rental Buildings Furnished Apartments Add Rental Listing Rental Building Owners Renter’s Guide -
Buildings
New Development Condos Rental Buildings Luxury Condos Condo & Co-op Profiles and Ratings Top 10 Lists -
Insights
Features Market Data Market Reports & Research Neighborhoods 6sqft (Our Blog) Carter’s View Rental Building News & Offers Resources & Guides CityRealty Indices -
Company
About CityRealty How CityRealty Works Advertise with CityRealty Contact Us -
All information furnished regarding property for sale, rental or financing is from sources deemed reliable, but no warranty or representation is made as to the accuracy thereof and same is submitted subject to errors, omissions, change of price, rental or other conditions, prior sale, lease or financing or withdrawal without notice. All dimensions are approximate. For exact dimensions, you must hire your own architect or engineer and for no listing shall the number of bedrooms listed be considered a legal conclusion.
All closed sales data has been provided by the New York City Department of Finance via the Automated City Register Information System (ACRIS). No warranty or representation is made as to the accuracy of any data provided by ACRIS or any other sources.
CityRealty is committed to ensuring digital accessibility for individuals with disabilities. We are continuously working to improve the accessibility of our web experience for everyone, and we welcome feedback and accommodation requests. If you wish to report an issue or seek an accommodation, please contact us at accessibility@cityrealty.com.
District\/BPC","_fd"],"4":[40.682676,-73.973007,"Brooklyn","_b"],"12":[40.8444,-73.9376,"Upper Manhattan","_um"],"5":[40.7477089,-73.930411,"LIC \/ Queens","_qns"],"18":[40.8889782,-73.9025,"The Bronx","_bx"]}