Shh... Many units sell without being publicly listed.
Explore off-market possibilities at 87 Barrow Street – inquire to find out about residences with owners open to private offers!
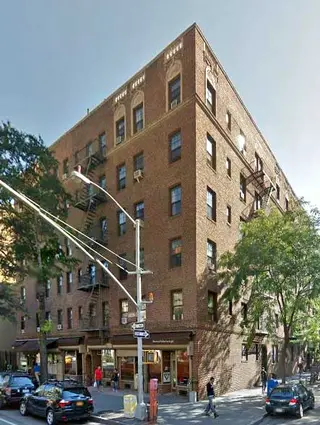
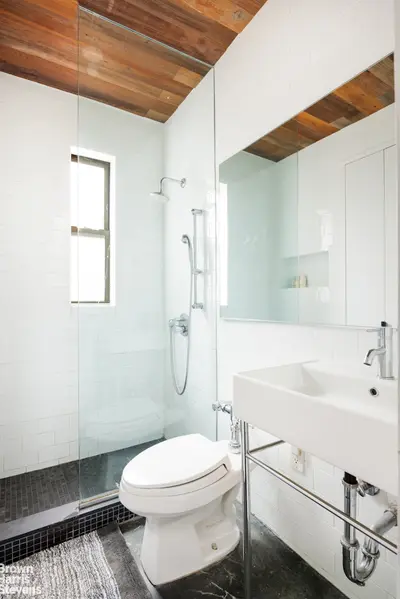
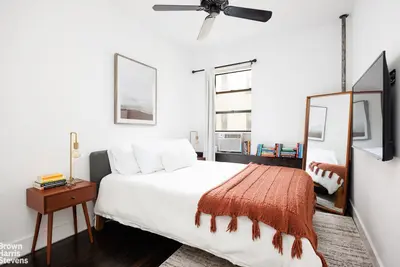
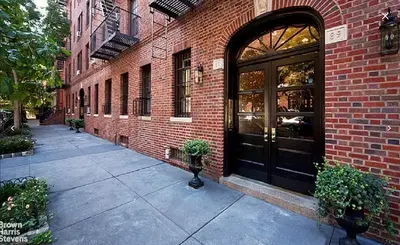
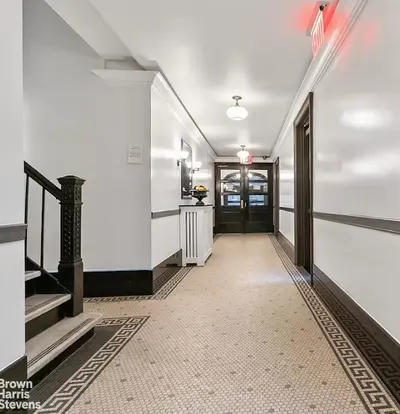


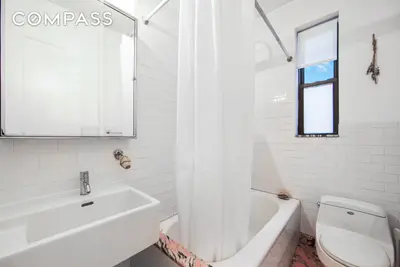

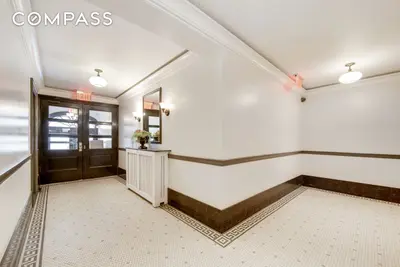
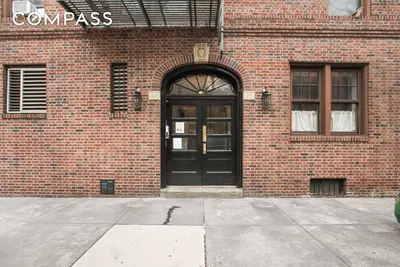
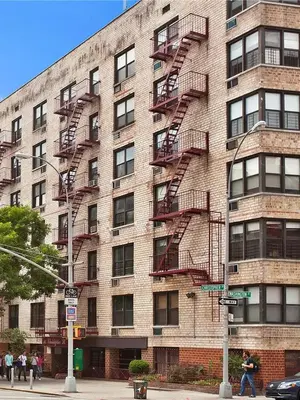
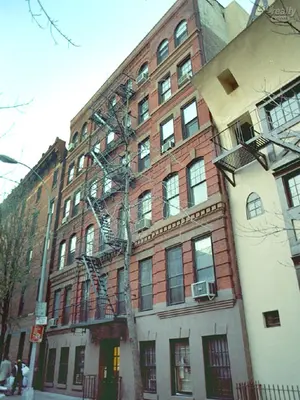
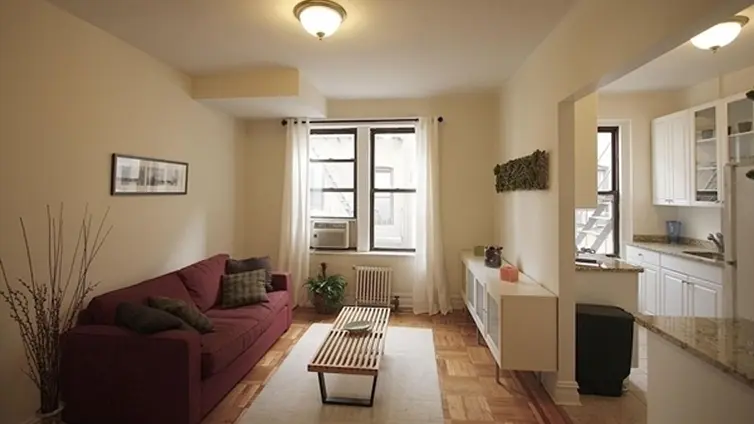
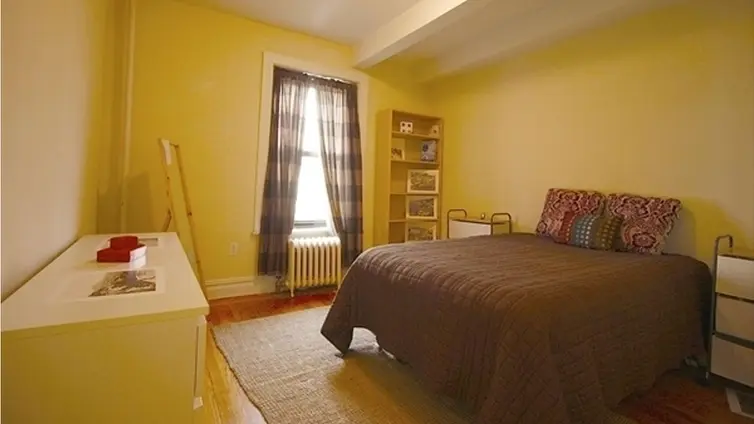
87 Barrow Street is a six-story cooperative comprising 169 apartments and located in the heart of the West Village. The co-op offers a live-in super who collects all packages and places them in a secured mailroom, providing the convenience of a doorman without the extra cost.
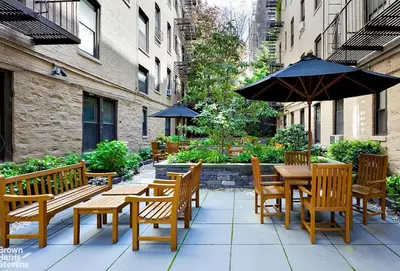
There are two beautifully landscaped courtyards, a smart technology video intercom, a laundry room, bicycle storage, and private storage units. The building is steps away from some of Manhattan's most acclaimed restaurants, shops, Hudson River Park, Equinox Printing House, and the West 4th subway stop. Subletting is permitted with board approval (three years out of every five), and the building allows pets, pied-a-terres, guarantors, and parental purchasing.
Explore off-market possibilities at 87 Barrow Street – inquire to find out about residences with owners open to private offers!

View school info, local attractions, transportation options & more.
Experience amazing 3D aerial maps and fly throughs.
For some co-ops, instead of price per square foot, we use an estimate of the number of rooms for each sold apartment to chart price changes over time. This is because many co-op listings do not include square footage information, and this makes it challenging to calculate accurate square-foot averages.
By displaying the price per estimated room count, we are able to provide a more reliable and consistent metric for comparing sales in the building. While we hope that this gives you a clearer sense of price trends in the building, all data should be independently verified. All data provided are only estimates and should not be used to make any purchase or sale decision.
|
Year
Avg Price / Room (Est)
Avg. Actual Price
Med. Actual Price
Transactions
2025
$261,667
$785,000
1
2024
$276,667
$867,500
4
2023
$260,000
$780,000
1
2022
$259,151
$865,622
11
2021
$264,861
$794,583
12
2020
$227,778
$822,714
7
2019
$259,000
$812,438
8
2018
$257,850
$819,800
5
2017
$273,264
$970,677
11
2016
$272,463
$851,000
9
2015
$283,410
$888,622
7
2014
$228,167
$749,077
13
|
Year
Avg Price / Room (Est)
Avg. Actual Price
Med. Actual Price
Transactions
2013
$224,805
$804,198
16
2012
$200,800
$599,500
8
2011
$184,983
$554,950
10
2010
$181,750
$555,929
7
2009
$183,822
$599,897
14
2008
$207,381
$694,400
10
2007
$206,567
$689,721
14
2006
$184,479
$569,403
24
2005
$167,258
$525,977
31
2004
$135,321
$415,727
17
2003
$88,528
$291,333
3
|
the following is a slider of images. For screen reader users, all slides are visible at all time so you may ignore control buttons.
Sign-up and we'll email you new listings in this building!
Whether you’re a buyer, investor, or simply curious, this report is your key to unlocking in-depth insights and analysis on .
Please confirm your details: