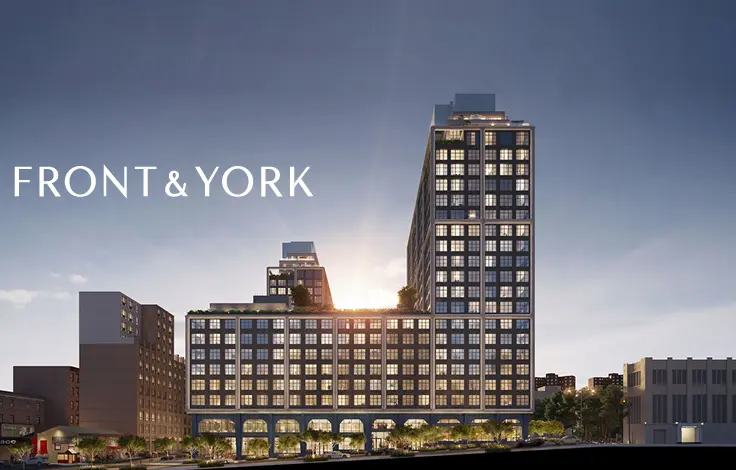
The Esquire Building, 330 Wythe Avenue: Price Comparison
between South 1st Street & South 2nd Street Building Profile
The Esquire Building
$1,432
Avg. Price / ft2
Past 12 months
Past 12 months
2023
-
2022
$1,696
2021
$1,355
2020
-
2019
$1,167
2018
-
2017
$1,532
2016
$1,532
2015
$1,090
2014
$1,478
2013
$1,346
2012
$1,204
2011
$843
2010
-
2009
$602
2008
$829
2007
$1,075
2006
$651
2005
$560
2004
$559
2003
$511
The Esquire Building
$1,850,000
Avg. Price
Past 12 months
Past 12 months
2023
-
2022
$1,780,000
2021
$2,437,750
2020
-
2019
$1,600,000
2018
-
2017
$1,969,167
2016
$1,757,500
2015
$1,525,000
2014
$2,370,000
2013
$1,731,025
2012
$1,372,750
2011
$1,291,333
2010
-
2009
$962,500
2008
$959,000
2007
$999,900
2006
$762,500
2005
$732,500
2004
$682,500
2003
$579,604
The Esquire Building
$1,432
Median Price / ft2
Past 12 months
Past 12 months
2023
-
2022
$1,696
2021
$1,379
2020
-
2019
$1,167
2018
-
2017
$1,478
2016
$1,532
2015
$1,090
2014
$1,453
2013
$1,346
2012
$1,204
2011
$811
2010
-
2009
$602
2008
$773
2007
$1,075
2006
$645
2005
$560
2004
$559
2003
$375
The Esquire Building
$1,850,000
Median Price
Past 12 months
Past 12 months
2023
-
2022
$1,780,000
2021
$2,265,500
2020
-
2019
$1,600,000
2018
-
2017
$1,825,000
2016
$1,757,500
2015
$1,525,000
2014
$1,555,000
2013
$1,731,025
2012
$1,372,750
2011
$1,419,000
2010
-
2009
$962,500
2008
$981,000
2007
$999,900
2006
$750,000
2005
$732,500
2004
$682,500
2003
$540,000
The Esquire Building
N/A
Avg. Price / ft2
Past 12 months
Past 12 months
2023
-
2022
-
2021
-
2020
-
2019
-
2018
-
2017
-
2016
-
2015
-
2014
-
2013
-
2012
-
2011
-
2010
-
2009
-
2008
-
2007
-
2006
-
2005
-
2004
-
2003
-
The Esquire Building
N/A
Avg. Price
Past 12 months
Past 12 months
2023
-
2022
-
2021
-
2020
-
2019
-
2018
-
2017
-
2016
-
2015
-
2014
-
2013
-
2012
-
2011
-
2010
-
2009
-
2008
-
2007
-
2006
-
2005
-
2004
-
2003
-
The Esquire Building
N/A
Median Price / ft2
Past 12 months
Past 12 months
2023
-
2022
-
2021
-
2020
-
2019
-
2018
-
2017
-
2016
-
2015
-
2014
-
2013
-
2012
-
2011
-
2010
-
2009
-
2008
-
2007
-
2006
-
2005
-
2004
-
2003
-
The Esquire Building
N/A
Median Price
Past 12 months
Past 12 months
2023
-
2022
-
2021
-
2020
-
2019
-
2018
-
2017
-
2016
-
2015
-
2014
-
2013
-
2012
-
2011
-
2010
-
2009
-
2008
-
2007
-
2006
-
2005
-
2004
-
2003
-
The Esquire Building
N/A
Avg. Price / ft2
Past 12 months
Past 12 months
2023
-
2022
$1,557
2021
-
2020
-
2019
-
2018
-
2017
$1,478
2016
$2,009
2015
-
2014
$1,453
2013
$1,346
2012
$1,378
2011
$777
2010
-
2009
-
2008
$915
2007
$1,075
2006
$652
2005
$521
2004
$546
2003
$611
The Esquire Building
N/A
Avg. Price
Past 12 months
Past 12 months
2023
-
2022
$1,660,000
2021
-
2020
-
2019
-
2018
-
2017
$1,850,000
2016
$2,190,000
2015
-
2014
$1,447,500
2013
$1,731,025
2012
$1,275,000
2011
$855,000
2010
-
2009
-
2008
$943,333
2007
$999,900
2006
$745,000
2005
$625,000
2004
$565,000
2003
$640,667
The Esquire Building
N/A
Median Price / ft2
Past 12 months
Past 12 months
2023
-
2022
$1,557
2021
-
2020
-
2019
-
2018
-
2017
$1,478
2016
$2,009
2015
-
2014
$1,453
2013
$1,346
2012
$1,378
2011
$777
2010
-
2009
-
2008
$892
2007
$1,075
2006
$642
2005
$521
2004
$546
2003
$737
The Esquire Building
N/A
Median Price
Past 12 months
Past 12 months
2023
-
2022
$1,660,000
2021
-
2020
-
2019
-
2018
-
2017
$1,850,000
2016
$2,190,000
2015
-
2014
$1,447,500
2013
$1,731,025
2012
$1,275,000
2011
$855,000
2010
-
2009
-
2008
$981,000
2007
$999,900
2006
$750,000
2005
$625,000
2004
$565,000
2003
$685,000
The Esquire Building
$1,432
Avg. Price / ft2
Past 12 months
Past 12 months
2023
-
2022
$1,836
2021
$1,396
2020
-
2019
$1,167
2018
-
2017
$1,559
2016
$1,055
2015
$1,090
2014
$1,057
2013
-
2012
$1,030
2011
$876
2010
-
2009
$602
2008
$701
2007
-
2006
$649
2005
$600
2004
$571
2003
$361
The Esquire Building
$1,850,000
Avg. Price
Past 12 months
Past 12 months
2023
-
2022
$1,900,000
2021
$2,265,500
2020
-
2019
$1,600,000
2018
-
2017
$2,028,750
2016
$1,325,000
2015
$1,525,000
2014
$1,585,000
2013
-
2012
$1,470,500
2011
$1,509,500
2010
-
2009
$962,500
2008
$982,500
2007
-
2006
$815,000
2005
$840,000
2004
$800,000
2003
$488,010
The Esquire Building
$1,432
Median Price / ft2
Past 12 months
Past 12 months
2023
-
2022
$1,836
2021
$1,396
2020
-
2019
$1,167
2018
-
2017
$1,540
2016
$1,055
2015
$1,090
2014
$1,057
2013
-
2012
$1,030
2011
$876
2010
-
2009
$602
2008
$701
2007
-
2006
$649
2005
$600
2004
$571
2003
$361
The Esquire Building
$1,850,000
Median Price
Past 12 months
Past 12 months
2023
-
2022
$1,900,000
2021
$2,265,500
2020
-
2019
$1,600,000
2018
-
2017
$1,825,000
2016
$1,325,000
2015
$1,525,000
2014
$1,585,000
2013
-
2012
$1,470,500
2011
$1,509,500
2010
-
2009
$962,500
2008
$982,500
2007
-
2006
$815,000
2005
$840,000
2004
$800,000
2003
$488,010
The Esquire Building
N/A
Avg. Price / ft2
Past 12 months
Past 12 months
2023
-
2022
-
2021
$1,390
2020
-
2019
-
2018
-
2017
-
2016
-
2015
-
2014
$1,952
2013
-
2012
-
2011
-
2010
-
2009
-
2008
-
2007
-
2006
-
2005
-
2004
-
2003
-
The Esquire Building
N/A
Avg. Price
Past 12 months
Past 12 months
2023
-
2022
-
2021
$2,000,000
2020
-
2019
-
2018
-
2017
-
2016
-
2015
-
2014
$5,000,000
2013
-
2012
-
2011
-
2010
-
2009
-
2008
-
2007
-
2006
-
2005
-
2004
-
2003
-
The Esquire Building
N/A
Median Price / ft2
Past 12 months
Past 12 months
2023
-
2022
-
2021
$1,390
2020
-
2019
-
2018
-
2017
-
2016
-
2015
-
2014
$1,952
2013
-
2012
-
2011
-
2010
-
2009
-
2008
-
2007
-
2006
-
2005
-
2004
-
2003
-
The Esquire Building
N/A
Median Price
Past 12 months
Past 12 months
2023
-
2022
-
2021
$2,000,000
2020
-
2019
-
2018
-
2017
-
2016
-
2015
-
2014
$5,000,000
2013
-
2012
-
2011
-
2010
-
2009
-
2008
-
2007
-
2006
-
2005
-
2004
-
2003
-
The Esquire Building
N/A
Avg. Price / ft2
Past 12 months
Past 12 months
2023
-
2022
-
2021
$1,238
2020
-
2019
-
2018
-
2017
-
2016
-
2015
-
2014
-
2013
-
2012
-
2011
-
2010
-
2009
-
2008
-
2007
-
2006
-
2005
-
2004
-
2003
-
The Esquire Building
N/A
Avg. Price
Past 12 months
Past 12 months
2023
-
2022
-
2021
$3,220,000
2020
-
2019
-
2018
-
2017
-
2016
-
2015
-
2014
-
2013
-
2012
-
2011
-
2010
-
2009
-
2008
-
2007
-
2006
-
2005
-
2004
-
2003
-
The Esquire Building
N/A
Median Price / ft2
Past 12 months
Past 12 months
2023
-
2022
-
2021
$1,238
2020
-
2019
-
2018
-
2017
-
2016
-
2015
-
2014
-
2013
-
2012
-
2011
-
2010
-
2009
-
2008
-
2007
-
2006
-
2005
-
2004
-
2003
-
The Esquire Building
N/A
Median Price
Past 12 months
Past 12 months
2023
-
2022
-
2021
$3,220,000
2020
-
2019
-
2018
-
2017
-
2016
-
2015
-
2014
-
2013
-
2012
-
2011
-
2010
-
2009
-
2008
-
2007
-
2006
-
2005
-
2004
-
2003
-
The Esquire Building
N/A
Avg. Price / ft2
Past 12 months
Past 12 months
2023
-
2022
-
2021
-
2020
-
2019
-
2018
-
2017
-
2016
-
2015
-
2014
-
2013
-
2012
-
2011
-
2010
-
2009
-
2008
-
2007
-
2006
-
2005
-
2004
-
2003
-
The Esquire Building
N/A
Avg. Price
Past 12 months
Past 12 months
2023
-
2022
-
2021
-
2020
-
2019
-
2018
-
2017
-
2016
-
2015
-
2014
-
2013
-
2012
-
2011
-
2010
-
2009
-
2008
-
2007
-
2006
-
2005
-
2004
-
2003
-
The Esquire Building
N/A
Median Price / ft2
Past 12 months
Past 12 months
2023
-
2022
-
2021
-
2020
-
2019
-
2018
-
2017
-
2016
-
2015
-
2014
-
2013
-
2012
-
2011
-
2010
-
2009
-
2008
-
2007
-
2006
-
2005
-
2004
-
2003
-
The Esquire Building
N/A
Median Price
Past 12 months
Past 12 months
2023
-
2022
-
2021
-
2020
-
2019
-
2018
-
2017
-
2016
-
2015
-
2014
-
2013
-
2012
-
2011
-
2010
-
2009
-
2008
-
2007
-
2006
-
2005
-
2004
-
2003
-
224 Richardson Street
N/A
Avg. Price / ft2
Past 12 months
Past 12 months
$1,492
-
-
-
-
-
$1,174
-
-
-
-
-
-
-
-
-
-
-
-
-
-
224 Richardson Street
N/A
Avg. Price
Past 12 months
Past 12 months
$1,440,000
-
-
-
-
-
$1,026,729
-
-
-
-
-
-
-
-
-
-
-
-
-
-
224 Richardson Street
N/A
Median Price / ft2
Past 12 months
Past 12 months
$1,492
-
-
-
-
-
$1,231
-
-
-
-
-
-
-
-
-
-
-
-
-
-
224 Richardson Street
N/A
Median Price
Past 12 months
Past 12 months
$1,440,000
-
-
-
-
-
$1,126,326
-
-
-
-
-
-
-
-
-
-
-
-
-
-
224 Richardson Street
N/A
Avg. Price / ft2
Past 12 months
Past 12 months
-
-
-
-
-
-
-
-
-
-
-
-
-
-
-
-
-
-
-
-
-
224 Richardson Street
N/A
Avg. Price
Past 12 months
Past 12 months
-
-
-
-
-
-
-
-
-
-
-
-
-
-
-
-
-
-
-
-
-
224 Richardson Street
N/A
Median Price / ft2
Past 12 months
Past 12 months
-
-
-
-
-
-
-
-
-
-
-
-
-
-
-
-
-
-
-
-
-
224 Richardson Street
N/A
Median Price
Past 12 months
Past 12 months
-
-
-
-
-
-
-
-
-
-
-
-
-
-
-
-
-
-
-
-
-
224 Richardson Street
N/A
Avg. Price / ft2
Past 12 months
Past 12 months
-
-
-
-
-
-
$1,098
-
-
-
-
-
-
-
-
-
-
-
-
-
-
224 Richardson Street
N/A
Avg. Price
Past 12 months
Past 12 months
-
-
-
-
-
-
$872,892
-
-
-
-
-
-
-
-
-
-
-
-
-
-
224 Richardson Street
N/A
Median Price / ft2
Past 12 months
Past 12 months
-
-
-
-
-
-
$1,098
-
-
-
-
-
-
-
-
-
-
-
-
-
-
224 Richardson Street
N/A
Median Price
Past 12 months
Past 12 months
-
-
-
-
-
-
$872,892
-
-
-
-
-
-
-
-
-
-
-
-
-
-
224 Richardson Street
N/A
Avg. Price / ft2
Past 12 months
Past 12 months
$1,492
-
-
-
-
-
$1,251
-
-
-
-
-
-
-
-
-
-
-
-
-
-
224 Richardson Street
N/A
Avg. Price
Past 12 months
Past 12 months
$1,440,000
-
-
-
-
-
$1,180,567
-
-
-
-
-
-
-
-
-
-
-
-
-
-
224 Richardson Street
N/A
Median Price / ft2
Past 12 months
Past 12 months
$1,492
-
-
-
-
-
$1,251
-
-
-
-
-
-
-
-
-
-
-
-
-
-
224 Richardson Street
N/A
Median Price
Past 12 months
Past 12 months
$1,440,000
-
-
-
-
-
$1,180,567
-
-
-
-
-
-
-
-
-
-
-
-
-
-
224 Richardson Street
N/A
Avg. Price / ft2
Past 12 months
Past 12 months
-
-
-
-
-
-
-
-
-
-
-
-
-
-
-
-
-
-
-
-
-
224 Richardson Street
N/A
Avg. Price
Past 12 months
Past 12 months
-
-
-
-
-
-
-
-
-
-
-
-
-
-
-
-
-
-
-
-
-
224 Richardson Street
N/A
Median Price / ft2
Past 12 months
Past 12 months
-
-
-
-
-
-
-
-
-
-
-
-
-
-
-
-
-
-
-
-
-
224 Richardson Street
N/A
Median Price
Past 12 months
Past 12 months
-
-
-
-
-
-
-
-
-
-
-
-
-
-
-
-
-
-
-
-
-
224 Richardson Street
N/A
Avg. Price / ft2
Past 12 months
Past 12 months
-
-
-
-
-
-
-
-
-
-
-
-
-
-
-
-
-
-
-
-
-
224 Richardson Street
N/A
Avg. Price
Past 12 months
Past 12 months
-
-
-
-
-
-
-
-
-
-
-
-
-
-
-
-
-
-
-
-
-
224 Richardson Street
N/A
Median Price / ft2
Past 12 months
Past 12 months
-
-
-
-
-
-
-
-
-
-
-
-
-
-
-
-
-
-
-
-
-
224 Richardson Street
N/A
Median Price
Past 12 months
Past 12 months
-
-
-
-
-
-
-
-
-
-
-
-
-
-
-
-
-
-
-
-
-
80 Metropolitan Avenue
$2,729
Avg. Price / ft2
Past 12 months
Past 12 months
$1,514
$1,468
$1,196
$1,358
$1,281
$1,328
$1,335
$1,452
$1,395
$1,197
$1,166
$874
$747
$748
$780
-
-
-
-
-
-
80 Metropolitan Avenue
$2,325,000
Avg. Price
Past 12 months
Past 12 months
$961,000
$1,331,666
$880,000
$1,431,500
$990,009
$896,000
$1,254,456
$1,325,496
$1,402,500
$1,131,858
$1,110,333
$683,392
$746,814
$710,080
$696,604
-
-
-
-
-
-
80 Metropolitan Avenue
$2,509
Median Price / ft2
Past 12 months
Past 12 months
$1,505
$1,458
$1,196
$1,358
$1,281
$1,307
$1,322
$1,382
$1,388
$1,239
$1,174
$805
$741
$736
$760
-
-
-
-
-
-
80 Metropolitan Avenue
$2,900,000
Median Price
Past 12 months
Past 12 months
$960,000
$999,999
$880,000
$1,431,500
$990,009
$850,000
$1,311,825
$962,500
$1,525,000
$1,225,000
$914,000
$501,930
$771,250
$570,000
$689,000
-
-
-
-
-
-
80 Metropolitan Avenue
N/A
Avg. Price / ft2
Past 12 months
Past 12 months
$1,505
$1,271
-
-
-
$1,399
$1,394
$1,371
$1,245
$1,422
$1,118
$804
$717
$796
$762
-
-
-
-
-
-
80 Metropolitan Avenue
N/A
Avg. Price
Past 12 months
Past 12 months
$799,000
$825,000
-
-
-
$740,000
$752,000
$752,483
$732,500
$779,000
$685,500
$425,880
$412,802
$431,408
$425,942
-
-
-
-
-
-
80 Metropolitan Avenue
N/A
Median Price / ft2
Past 12 months
Past 12 months
$1,505
$1,271
-
-
-
$1,399
$1,394
$1,371
$1,245
$1,422
$1,118
$804
$720
$768
$747
-
-
-
-
-
-
80 Metropolitan Avenue
N/A
Median Price
Past 12 months
Past 12 months
$799,000
$825,000
-
-
-
$740,000
$752,000
$752,483
$732,500
$779,000
$685,500
$425,880
$404,793
$409,863
$426,968
-
-
-
-
-
-
80 Metropolitan Avenue
$2,906
Avg. Price / ft2
Past 12 months
Past 12 months
$1,519
$1,458
$1,196
-
$1,281
$1,268
$1,267
$1,336
-
$1,237
$1,199
$882
$757
$743
$784
-
-
-
-
-
-
80 Metropolitan Avenue
$2,037,500
Avg. Price
Past 12 months
Past 12 months
$1,042,000
$999,999
$880,000
-
$990,009
$865,000
$939,000
$941,333
-
$857,550
$827,667
$633,465
$539,398
$529,313
$560,702
-
-
-
-
-
-
80 Metropolitan Avenue
$2,906
Median Price / ft2
Past 12 months
Past 12 months
$1,519
$1,458
$1,196
-
$1,281
$1,268
$1,267
$1,316
-
$1,237
$1,233
$882
$739
$753
$777
-
-
-
-
-
-
80 Metropolitan Avenue
$2,037,500
Median Price
Past 12 months
Past 12 months
$1,042,000
$999,999
$880,000
-
$990,009
$865,000
$939,000
$950,000
-
$857,550
$804,000
$633,465
$539,836
$539,500
$559,154
-
-
-
-
-
-
80 Metropolitan Avenue
$2,509
Avg. Price / ft2
Past 12 months
Past 12 months
-
-
-
$1,358
-
$1,307
$1,325
$1,606
$1,446
$1,147
$1,215
-
$753
$716
$797
-
-
-
-
-
-
80 Metropolitan Avenue
$2,900,000
Avg. Price
Past 12 months
Past 12 months
-
-
-
$1,431,500
-
$1,270,000
$1,518,530
$2,050,000
$1,633,333
$1,282,103
$1,288,000
-
$864,184
$789,222
$820,284
-
-
-
-
-
-
80 Metropolitan Avenue
$2,509
Median Price / ft2
Past 12 months
Past 12 months
-
-
-
$1,358
-
$1,307
$1,253
$1,606
$1,405
$1,239
$1,227
-
$745
$714
$758
-
-
-
-
-
-
80 Metropolitan Avenue
$2,900,000
Median Price
Past 12 months
Past 12 months
-
-
-
$1,431,500
-
$1,270,000
$1,439,000
$2,050,000
$1,575,000
$1,314,500
$1,260,000
-
$815,000
$755,000
$841,559
-
-
-
-
-
-
80 Metropolitan Avenue
N/A
Avg. Price / ft2
Past 12 months
Past 12 months
-
$1,674
-
-
-
-
-
$1,653
$1,540
-
$1,017
$1,002
$744
$745
$737
-
-
-
-
-
-
80 Metropolitan Avenue
N/A
Avg. Price
Past 12 months
Past 12 months
-
$2,170,000
-
-
-
-
-
$2,175,000
$2,050,000
-
$2,275,000
$1,298,268
$1,416,993
$1,261,250
$1,088,500
-
-
-
-
-
-
80 Metropolitan Avenue
N/A
Median Price / ft2
Past 12 months
Past 12 months
-
$1,674
-
-
-
-
-
$1,653
$1,540
-
$1,017
$1,002
$687
$719
$737
-
-
-
-
-
-
80 Metropolitan Avenue
N/A
Median Price
Past 12 months
Past 12 months
-
$2,170,000
-
-
-
-
-
$2,175,000
$2,050,000
-
$2,275,000
$1,298,268
$1,491,736
$1,293,750
$1,088,500
-
-
-
-
-
-
80 Metropolitan Avenue
N/A
Avg. Price / ft2
Past 12 months
Past 12 months
-
-
-
-
-
-
-
-
-
-
-
-
-
-
-
-
-
-
-
-
-
80 Metropolitan Avenue
N/A
Avg. Price
Past 12 months
Past 12 months
-
-
-
-
-
-
-
-
-
-
-
-
-
-
-
-
-
-
-
-
-
80 Metropolitan Avenue
N/A
Median Price / ft2
Past 12 months
Past 12 months
-
-
-
-
-
-
-
-
-
-
-
-
-
-
-
-
-
-
-
-
-
80 Metropolitan Avenue
N/A
Median Price
Past 12 months
Past 12 months
-
-
-
-
-
-
-
-
-
-
-
-
-
-
-
-
-
-
-
-
-
80 Metropolitan Avenue
N/A
Avg. Price / ft2
Past 12 months
Past 12 months
-
-
-
-
-
-
-
-
-
-
-
-
-
-
-
-
-
-
-
-
-
80 Metropolitan Avenue
N/A
Avg. Price
Past 12 months
Past 12 months
-
-
-
-
-
-
-
-
-
-
-
-
-
-
-
-
-
-
-
-
-
80 Metropolitan Avenue
N/A
Median Price / ft2
Past 12 months
Past 12 months
-
-
-
-
-
-
-
-
-
-
-
-
-
-
-
-
-
-
-
-
-
80 Metropolitan Avenue
N/A
Median Price
Past 12 months
Past 12 months
-
-
-
-
-
-
-
-
-
-
-
-
-
-
-
-
-
-
-
-
-


 6sqft delivers the latest on real estate, architecture, and design, straight from New York City.
