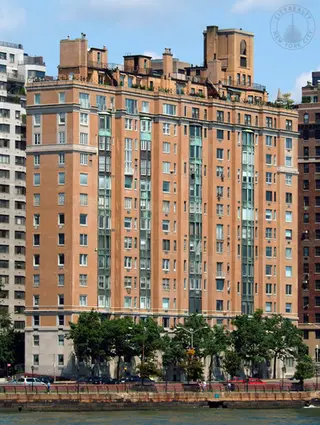
1 East End Avenue: Sales Summary
between East 79th Street & East 80th Street Building Profile
All Sales
$0
Avg. Price / ft2
Past 12 months, based on 1 sale
$4,050,000
Avg. Price -
Past 12 months, based on 1 sale
$0
Median Price / ft2
Past 12 months, based on 1 sale
$4,050,000
Median Price
Past 12 months, based on 1 sale
Year
Avg Price / Ft2
Median Price / Ft2
Avg. Actual Price
Med. Actual Price
Transactions
2025
-
-
-
-
0
2024
$578
$2,866,667
$578
$2,700,000
3
2023
-
-
-
-
0
2022
-
$3,400,000
-
$3,400,000
1
2021
-
$2,775,000
-
$2,775,000
1
2020
-
$2,600,000
-
$2,600,000
1
2019
-
-
-
-
0
2018
$1,174
$3,965,000
$1,280
$3,967,500
4
2017
-
$3,150,000
-
$3,150,000
2
2016
$1,673
$4,798,333
$1,673
$4,295,000
3
2015
-
-
-
-
0
2014
$1,771
$4,250,000
$1,771
$4,250,000
1
2013
-
-
-
-
0
Year
Avg Price / Ft2
Median Price / Ft2
Avg. Actual Price
Med. Actual Price
Transactions
2012
-
-
-
-
0
2011
-
-
-
-
0
2010
-
$3,075,000
$3,075,000
2
2009
-
$2,567,500
$2,567,500
1
2008
$1,083
$2,600,000
$1,083
$2,600,000
1
2007
-
$3,436,277
$3,436,277
1
2006
-
-
-
-
0
2005
-
$3,698,333
$3,550,000
3
2004
-
-
-
-
0
2003
-
-
-
-
0
The Breakdown of All Sales by Apartment Size