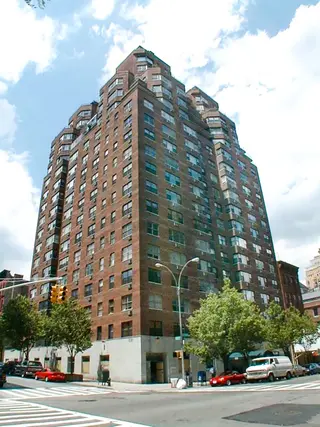
80 East End Avenue: Sales Summary
between East 83rd Street & East 84th Street Building Profile
All Sales
$1,169
Avg. Price / ft2
Past 12 months, based on 3 sales
$2,548,333
Avg. Price -
Past 12 months, based on 3 sales
$1,169
Median Price / ft2
Past 12 months, based on 3 sales
$2,100,000
Median Price
Past 12 months, based on 3 sales
Year
Avg Price / Ft2
Median Price / Ft2
Avg. Actual Price
Med. Actual Price
Transactions
2025
-
-
-
-
0
2024
$1,169
$2,065,500
$1,169
$1,897,500
4
2023
$777
$1,116,875
$777
$1,202,500
4
2022
$884
$685,000
$884
$685,000
1
2021
$790
$960,625
$761
$632,500
8
2020
$788
$565,500
$788
$577,500
5
2019
$1,132
$1,301,667
$1,132
$1,175,000
9
2018
$887
$882,500
$887
$882,500
2
2017
$865
$977,000
$865
$977,000
2
2016
$1,075
$1,398,500
$1,105
$1,292,500
3
2015
$1,152
$1,322,000
$1,152
$1,265,000
7
2014
$956
$814,643
$1,000
$615,000
7
2013
$969
$1,258,000
$969
$1,550,000
3
Year
Avg Price / Ft2
Median Price / Ft2
Avg. Actual Price
Med. Actual Price
Transactions
2012
$660
$750,750
$660
$776,500
4
2011
$900
$1,240,000
$985
$1,250,000
5
2010
$618
$710,000
$618
$710,000
2
2009
$798
$1,084,167
$786
$1,095,000
6
2008
$783
$947,833
$776
$510,000
6
2007
$705
$797,500
$705
$750,000
4
2006
$907
$917,500
$893
$982,500
5
2005
-
$1,107,000
$1,150,000
5
2004
$526
$530,833
$602
$547,500
6
2003
$535
$584,000
$560
$495,000
5
The Breakdown of All Sales by Apartment Size




 6sqft delivers the latest on real estate, architecture, and design, straight from New York City.
