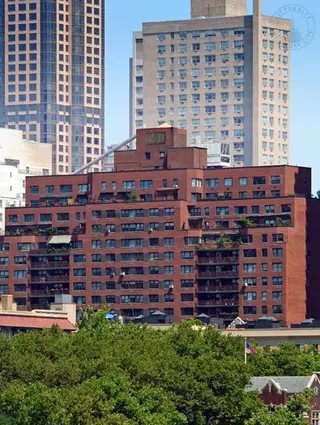
East River House, 505 East 79th Street: Sales Summary
between York Avenue & East End Avenue Building Profile
All Sales
$864
Avg. Price / ft2
Past 12 months, based on 7 sales
$890,714
Avg. Price -
Past 12 months, based on 7 sales
$860
Median Price / ft2
Past 12 months, based on 7 sales
$880,000
Median Price
Past 12 months, based on 7 sales
Year
Avg Price / Ft2
Median Price / Ft2
Avg. Actual Price
Med. Actual Price
Transactions
2025
$910
$903,000
$927
$880,000
5
2024
$804
$903,750
$773
$860,000
4
2023
$768
$646,458
$755
$572,500
12
2022
$861
$683,333
$840
$620,000
6
2021
$833
$865,885
$848
$715,000
13
2020
$770
$1,076,250
$770
$1,032,500
8
2019
$860
$1,095,000
$860
$1,040,000
6
2018
$896
$701,000
$984
$635,000
5
2017
$1,020
$1,488,563
$893
$865,000
8
2016
$972
$1,172,300
$946
$1,212,500
5
2015
$815
$861,250
$825
$567,500
6
2014
$769
$662,778
$728
$487,500
9
2013
$821
$924,000
$788
$825,000
5
Year
Avg Price / Ft2
Median Price / Ft2
Avg. Actual Price
Med. Actual Price
Transactions
2012
$632
$684,250
$623
$449,500
8
2011
$668
$734,500
$608
$564,000
6
2010
$685
$644,500
$698
$697,500
10
2009
$584
$753,571
$584
$610,000
7
2008
$650
$1,343,083
$650
$1,725,000
6
2007
$731
$1,024,615
$740
$850,900
13
2006
$737
$977,429
$752
$999,000
7
2005
$661
$607,964
$666
$560,000
14
2004
$564
$655,714
$564
$790,000
7
2003
$400
$598,214
$400
$455,000
7
The Breakdown of All Sales by Apartment Size