Eton House, 345 East 81st Street - Yorkville
- Apartments
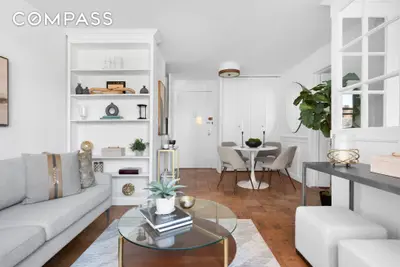
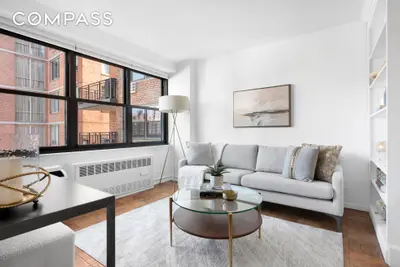
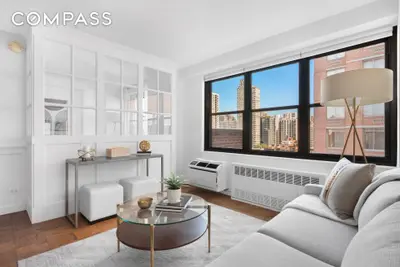
- Overview & Photos
- Maps
- Floorplans
- Sales Data & Comps
- Similar Buildings
- All Units
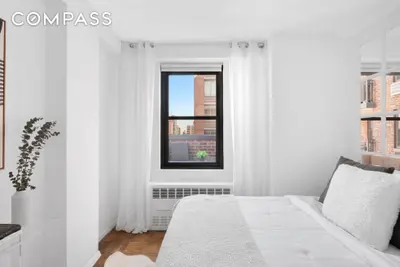
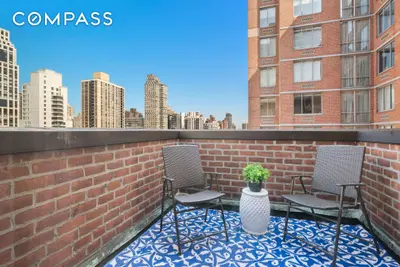
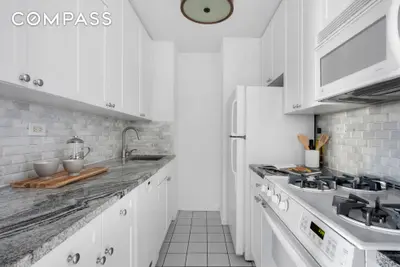

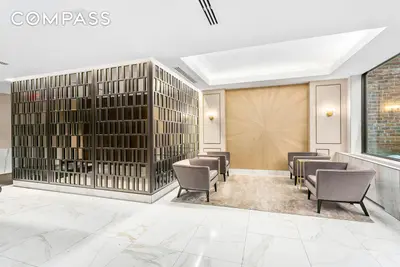
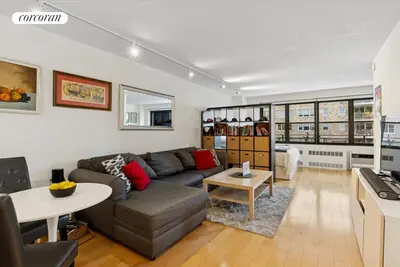
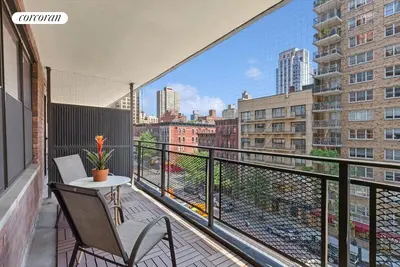
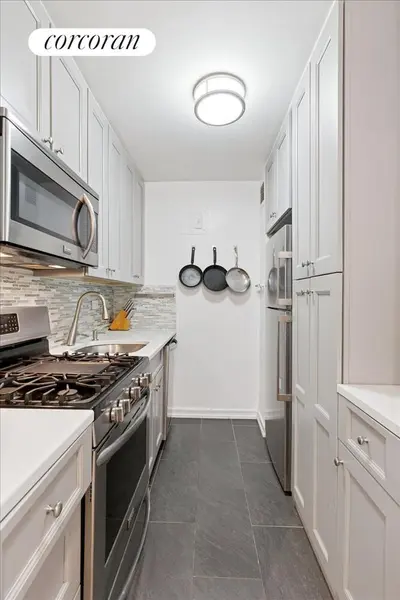
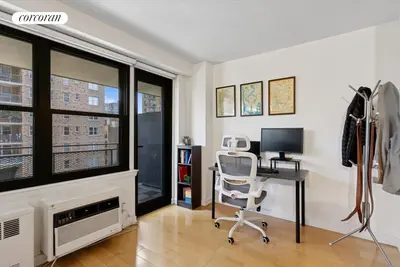
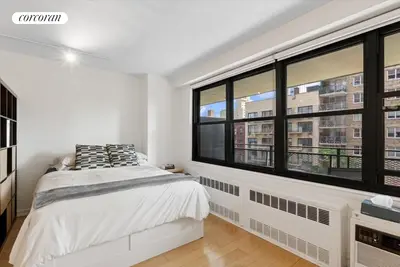
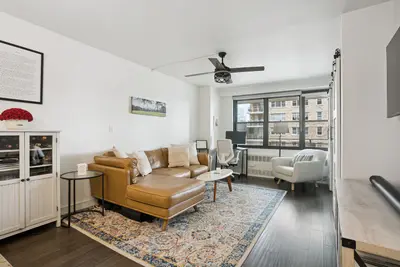
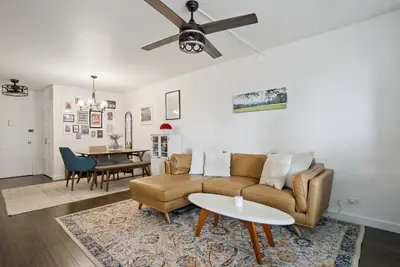
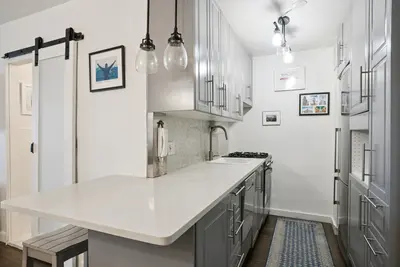
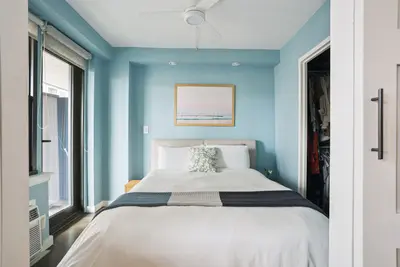
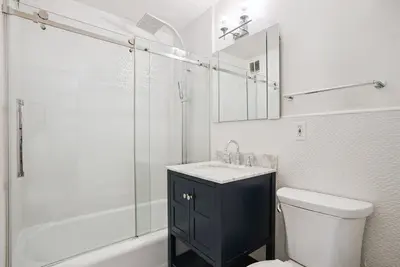
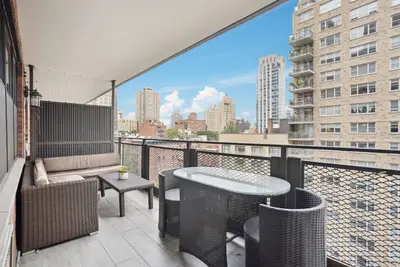
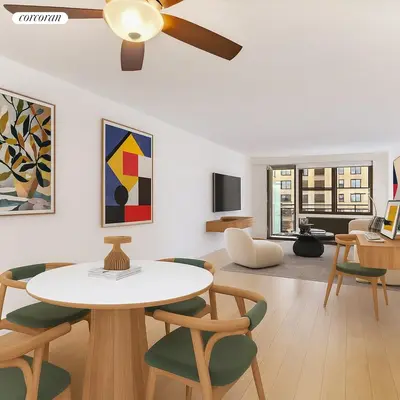
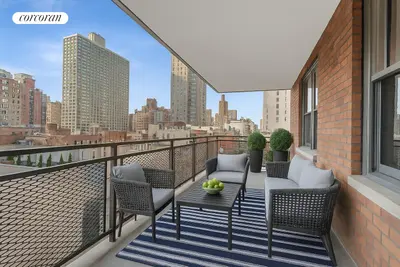
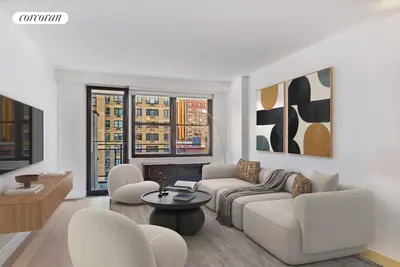
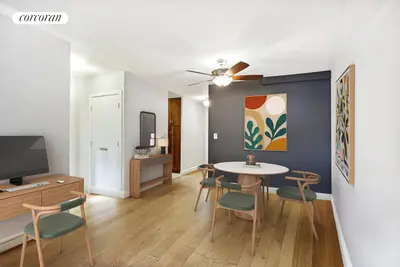
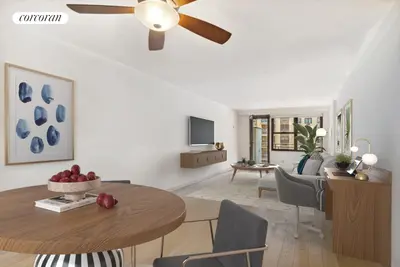
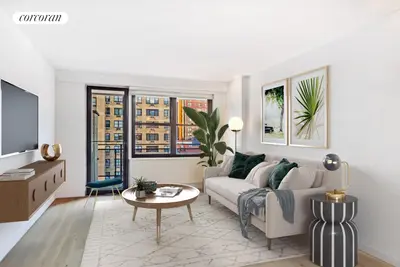
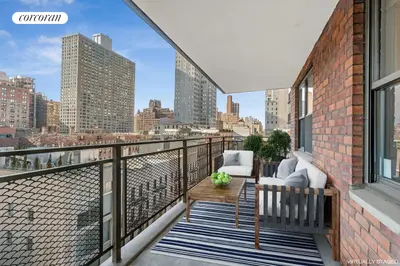
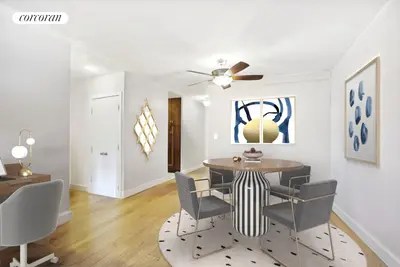
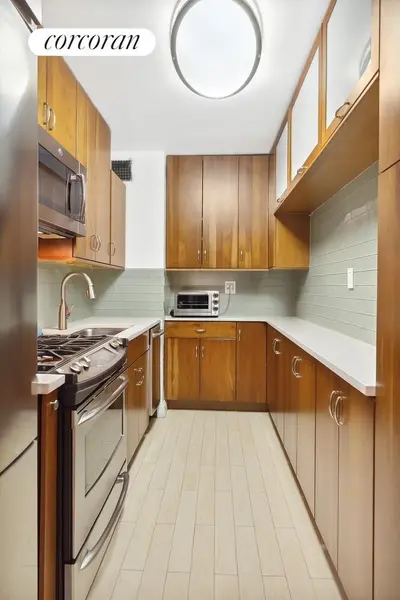
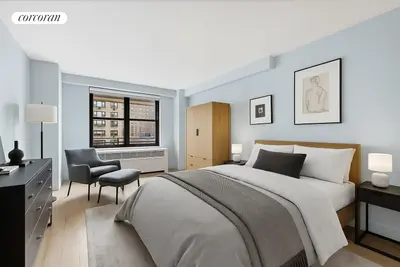
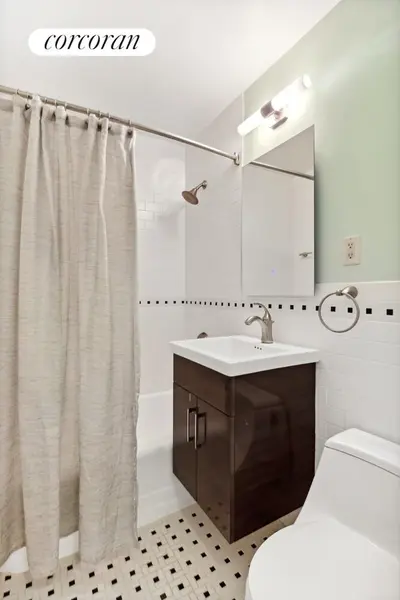
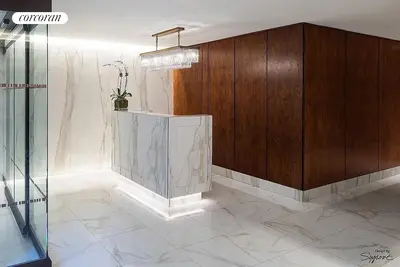
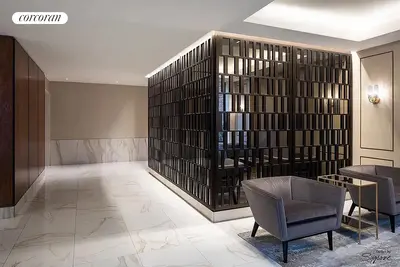

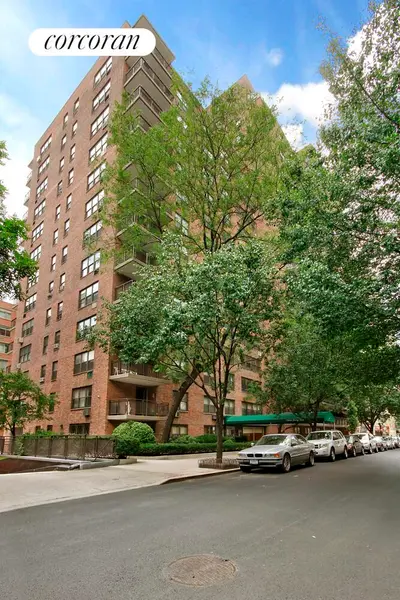
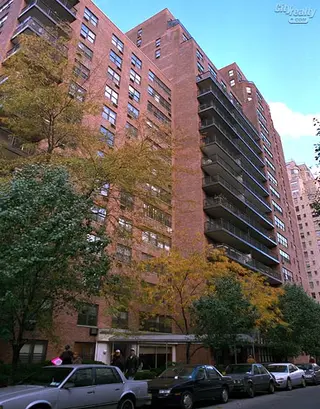
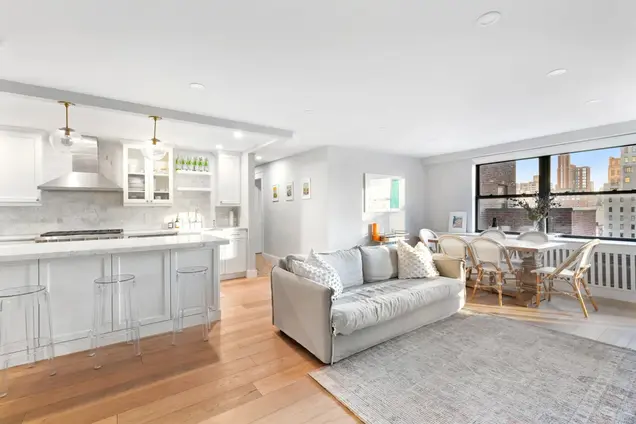
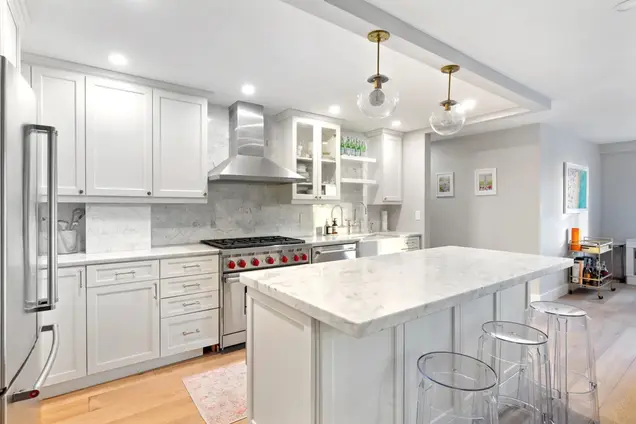
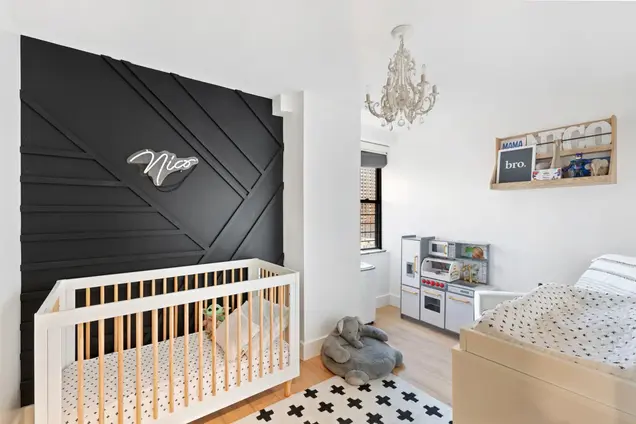
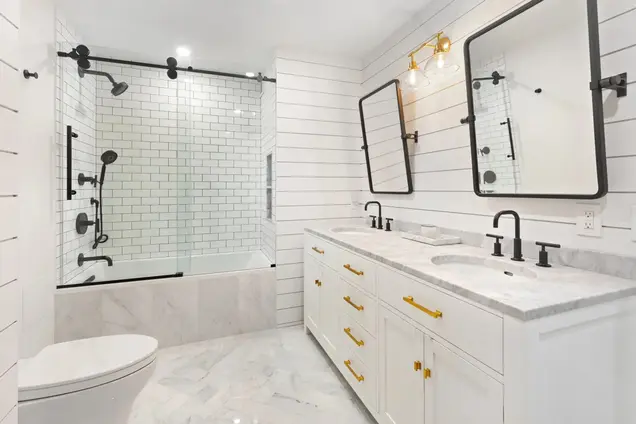
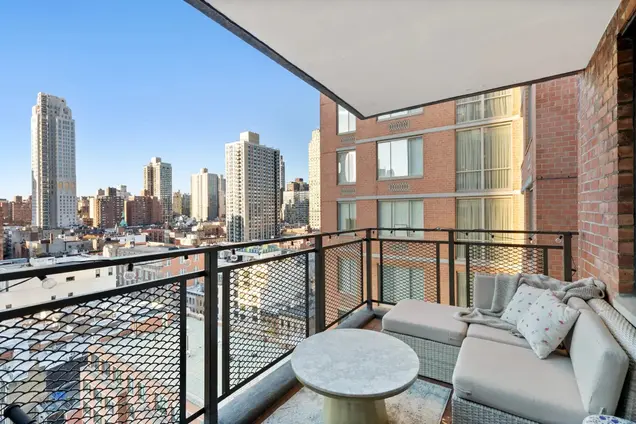
Eton House, constructed in 1963 and converted to a cooperative in 1983, is a 20-story residential building located at 345 East 81st Street on Manhattan's Upper East Side. The building's distinctive architectural feature is its system of recessed balconies, shared between apartments and separated by partitions, which create a strong horizontal emphasis in the façade. The property contains 214 apartments and recently underwent renovations to its lobby, common areas, and elevators.
The full-service building maintains a 24-hour doorman, live-in superintendent, and porter staff. Amenities include an on-site parking garage with direct building access, a large central laundry facility, and a newly added bike room. The building has consistently maintained healthy financials with relatively low maintenance charges and has successfully passed its Local Law 11 inspection in 2022 with no required work.
Situated on a tree-lined block, Eton House offers convenient access to several transportation options including the Second Avenue Q train, 4/5/6 subway lines, and crosstown buses on 79th and 86th Streets. The location provides easy access to Carl Schurz Park, the East River Promenade, and numerous shopping and dining options. A Morton Williams supermarket occupies the ground floor of the building.
The cooperative's policies are notably flexible, permitting pets, pied-à-terres (considered case-by-case), co-purchasing, gifting, and trust purchases with board approval. The building allows 75% financing and has demonstrated strong financial management through its history.


View school info, local attractions, transportation options & more.
Experience amazing 3D aerial maps and fly throughs.
For some co-ops, instead of price per square foot, we use an estimate of the number of rooms for each sold apartment to chart price changes over time. This is because many co-op listings do not include square footage information, and this makes it challenging to calculate accurate square-foot averages.
By displaying the price per estimated room count, we are able to provide a more reliable and consistent metric for comparing sales in the building. While we hope that this gives you a clearer sense of price trends in the building, all data should be independently verified. All data provided are only estimates and should not be used to make any purchase or sale decision.
Broker & Buyer Comments