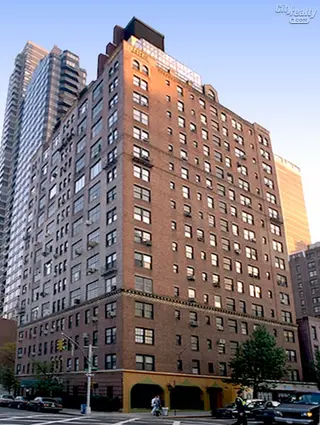
400 East 59th Street - Beekman/Sutton Place
- Apartments
- Overview & Photos
- Maps
- Floorplans
- Sales Data & Comps
- Similar Buildings
- All Units


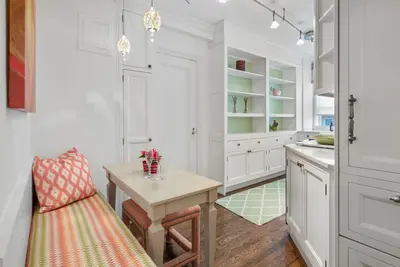
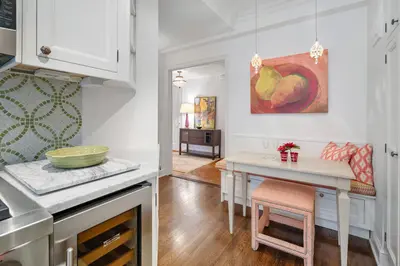
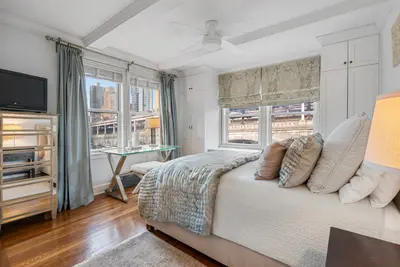
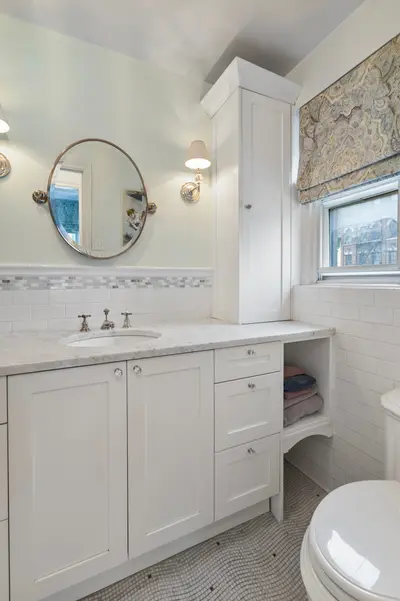
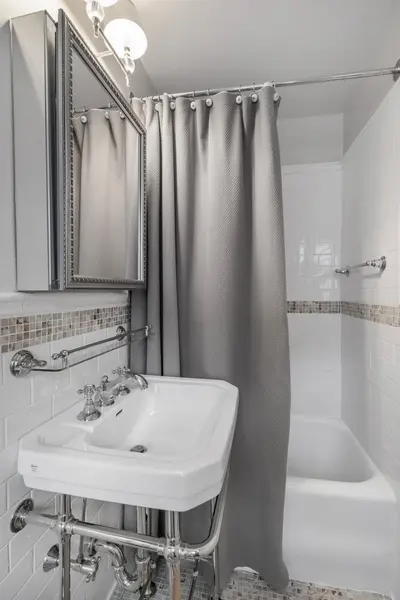


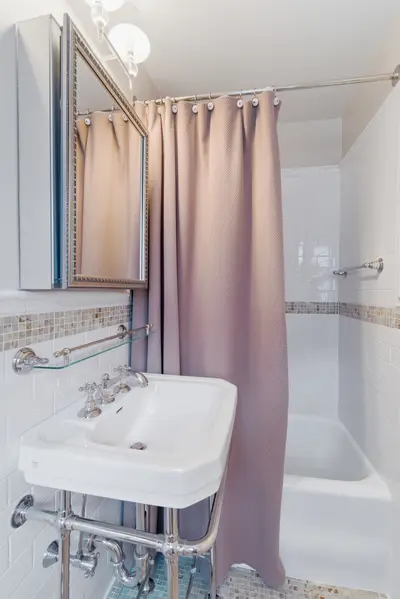


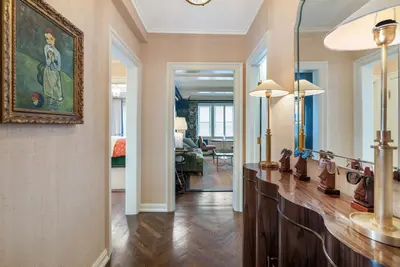
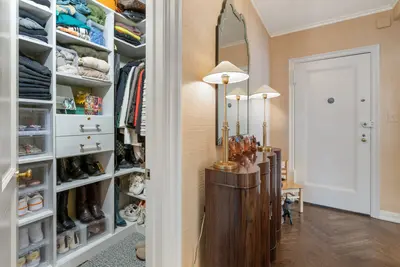


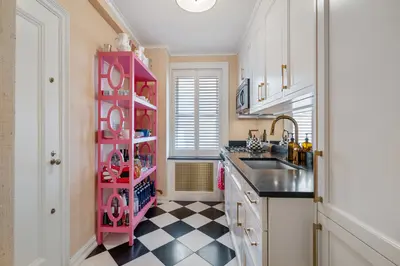
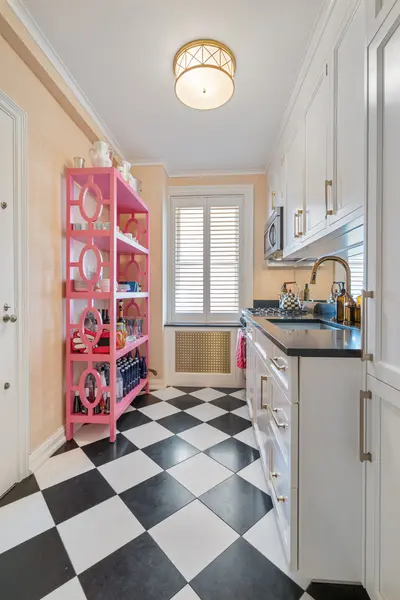


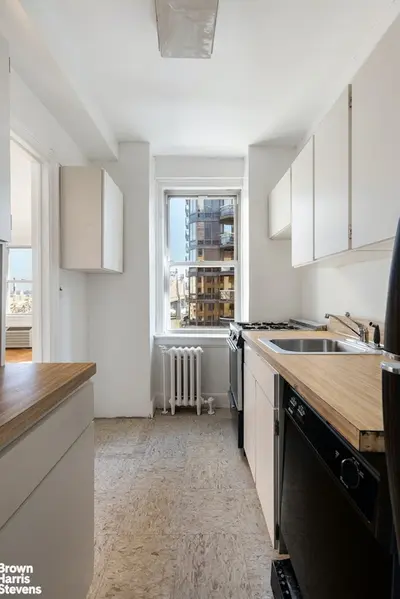
400 East 59th Street is a boutique pre-war Sutton Place co-op. Amenities include a full-time doorman, resident manager, planted courtyard garden, central laundry, bike room, and storage. Pets and pieds-a-terre are welcome. The building is located within easy access to 8 subway lines including the new Second Avenue subway. Quick access to the FDR Drive or 59th Street Bridge. The building is also close to many fine dining options, Whole Foods Market, and a few blocks to Bloomingdales


View school info, local attractions, transportation options & more.
Experience amazing 3D aerial maps and fly throughs.
For some co-ops, instead of price per square foot, we use an estimate of the number of rooms for each sold apartment to chart price changes over time. This is because many co-op listings do not include square footage information, and this makes it challenging to calculate accurate square-foot averages.
By displaying the price per estimated room count, we are able to provide a more reliable and consistent metric for comparing sales in the building. While we hope that this gives you a clearer sense of price trends in the building, all data should be independently verified. All data provided are only estimates and should not be used to make any purchase or sale decision.
Broker & Buyer Comments