Shh... Many units sell without being publicly listed.
Explore off-market possibilities at The Holland Court – inquire to find out about residences with owners open to private offers!
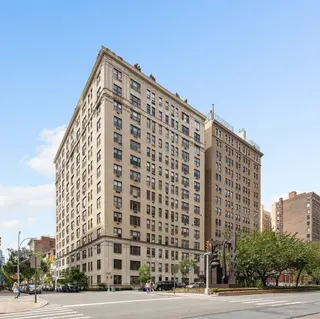
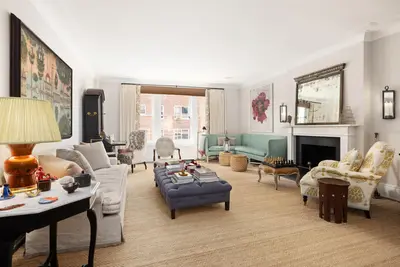
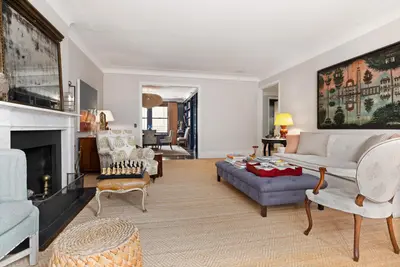
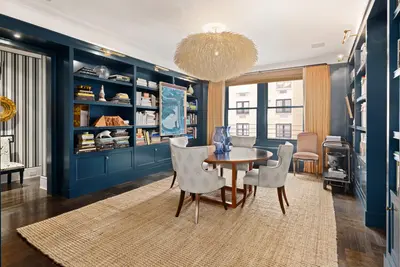
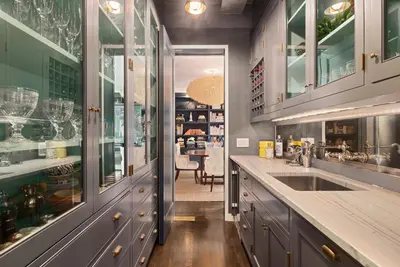
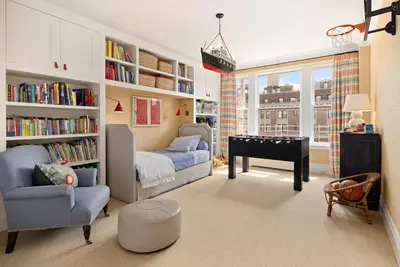
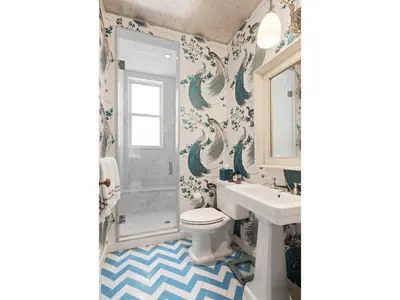
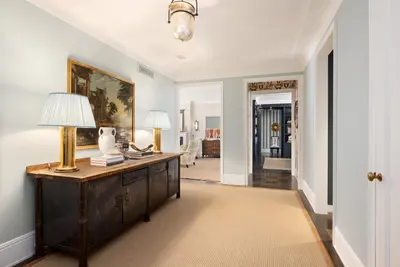
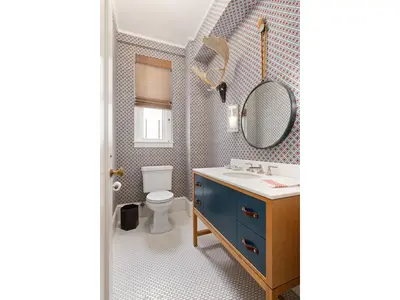
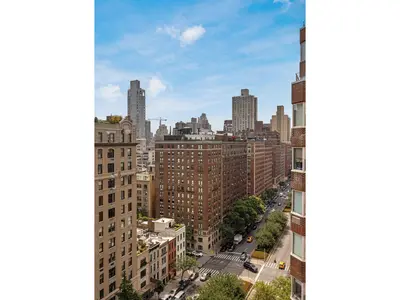
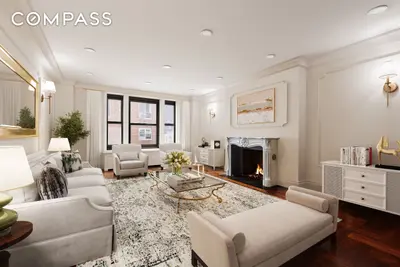
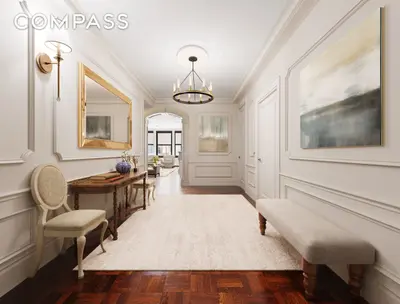
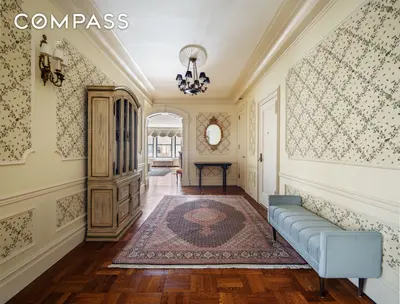
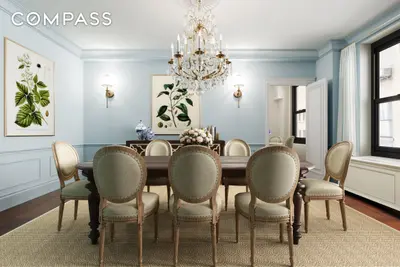
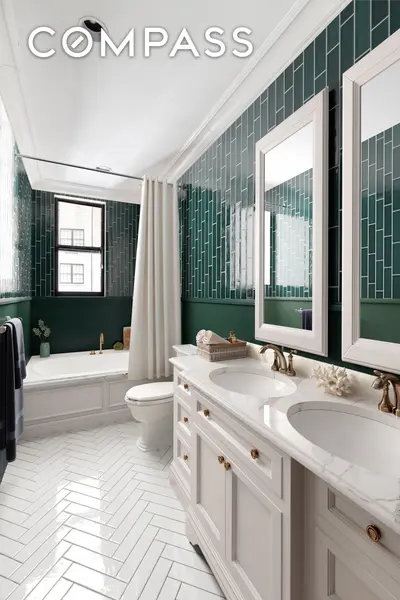
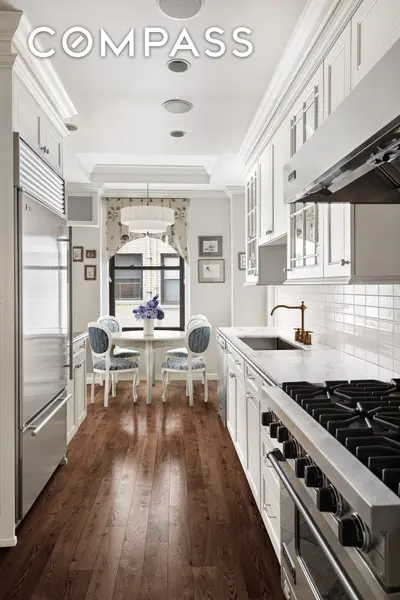
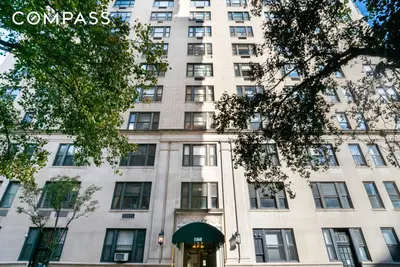
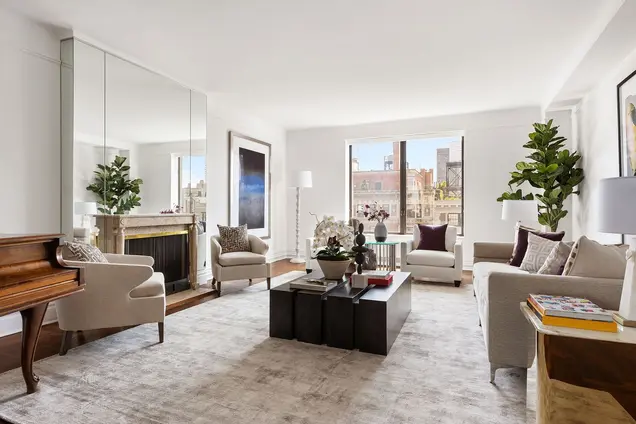
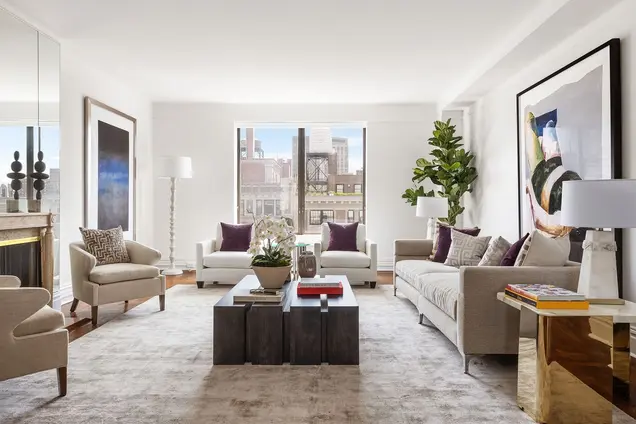
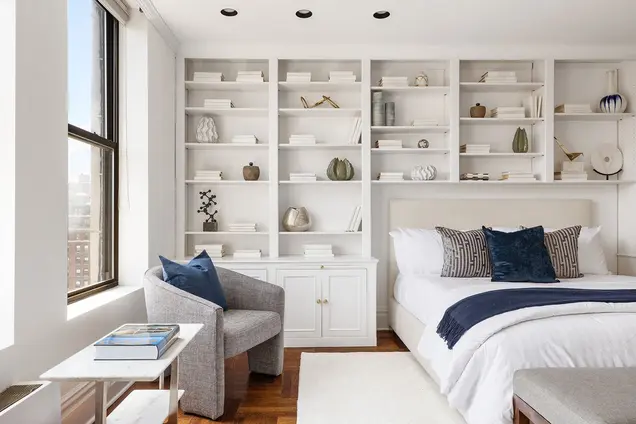
Holland Court, a charming pre-war cooperative, offers spacious layouts and fireplaces in the highly desirable Carnegie Hill neighborhood. Designed by George Pelham in 1926, this white-glove building features 64 apartments and was converted to cooperative ownership in 1968.
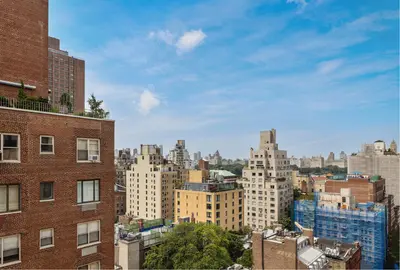
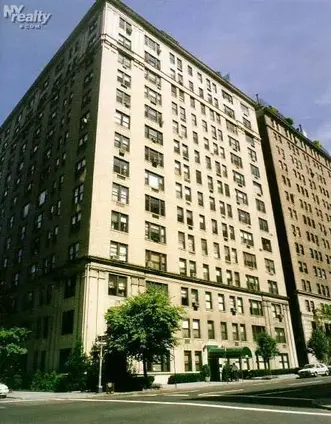
The 14-story red-brick tower showcases a distinctive three-story limestone base with elegant pilasters at its north and south ends along Park Avenue. These pilasters reappear on the top two floors, adorned with a balustrated bandcourse above the 12th floor.
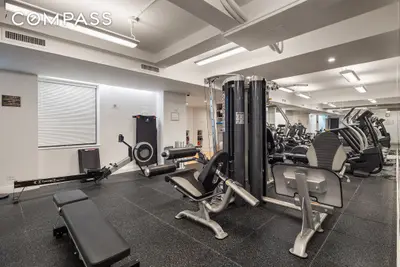
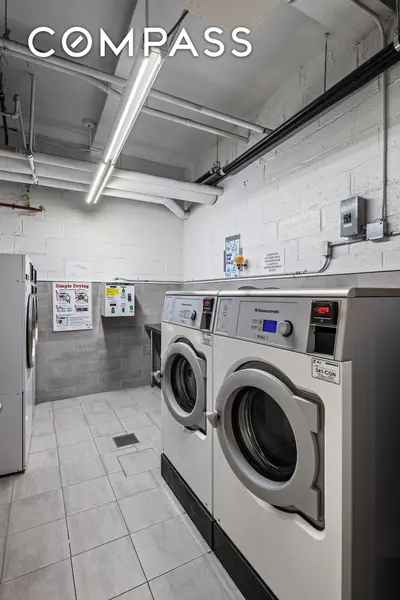
Residents enjoy the convenience of a full-time doorman, a live-in superintendent, porter services, a fitness center, storage, and a bicycle room. The cooperative allows for 50% financing and warmly welcomes pets. With its prime location and array of amenities, Holland Court offers a comfortable and stylish urban living experience.
Explore off-market possibilities at The Holland Court – inquire to find out about residences with owners open to private offers!

View school info, local attractions, transportation options & more.
Experience amazing 3D aerial maps and fly throughs.
For some co-ops, instead of price per square foot, we use an estimate of the number of rooms for each sold apartment to chart price changes over time. This is because many co-op listings do not include square footage information, and this makes it challenging to calculate accurate square-foot averages.
By displaying the price per estimated room count, we are able to provide a more reliable and consistent metric for comparing sales in the building. While we hope that this gives you a clearer sense of price trends in the building, all data should be independently verified. All data provided are only estimates and should not be used to make any purchase or sale decision.
|
Year
Avg Price / Room (Est)
Avg. Actual Price
Med. Actual Price
Transactions
2025
-
-
0
2024
$487,898
$3,222,500
2
2023
$695,652
$8,000,000
1
2022
-
-
0
2021
$400,549
$2,716,666
3
2020
-
-
0
2019
-
-
0
2018
-
-
0
2017
$644,722
$5,802,500
2
2016
-
-
0
2015
$627,427
$4,865,595
2
2014
$642,857
$4,500,000
1
|
Year
Avg Price / Room (Est)
Avg. Actual Price
Med. Actual Price
Transactions
2013
$585,000
$2,925,000
1
2012
$354,083
$2,527,562
2
2011
$394,518
$2,755,100
5
2010
$1,015,385
$6,600,000
1
2009
$687,500
$5,500,000
1
2008
$580,625
$4,025,000
3
2007
$616,667
$3,700,000
1
2006
$287,250
$2,074,167
3
2005
$589,963
$3,968,202
2
2004
$316,071
$1,933,333
3
2003
-
$1,650,000
1
|
the following is a slider of images. For screen reader users, all slides are visible at all time so you may ignore control buttons.


Sign-up and we'll email you new listings in this building!
Whether you’re a buyer, investor, or simply curious, this report is your key to unlocking in-depth insights and analysis on .
Please confirm your details:
